High Value Scenarios - 4-Step Load Test
High Value Scenarios consist of multiple elements that can help to describe attributes of an applications performance effectively. There are a few different scenarios that I use on a day to day basis, which provide excellent analysis points. In this post, I will attempt to explain one of the scenarios, how to build it, how to analyze the results and why it is effective.
Stair Step
My standard load test is a four-step stair step test. I use this for standard baselining as well as KPI analysis of throughput and response times.
It looks something like this:
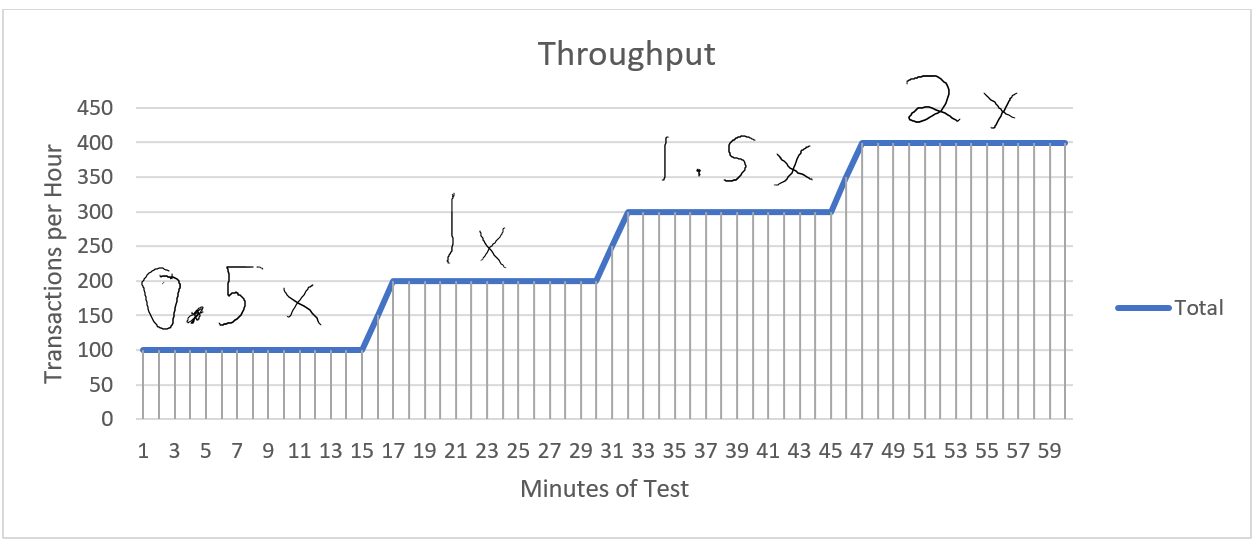
There are four stair steps each one accounting for 0.5X of the target throughput. Where X is defined as the average hourly load of the application, either projected or taken from actual production load.
Once you have X defined, use that to calculate the number of users you need using this previous post. After you have the number of users needed for 1X you can just start with .5X and add .5X every 15 Minutes for a total test time of one hour.
Analyzing Response Times
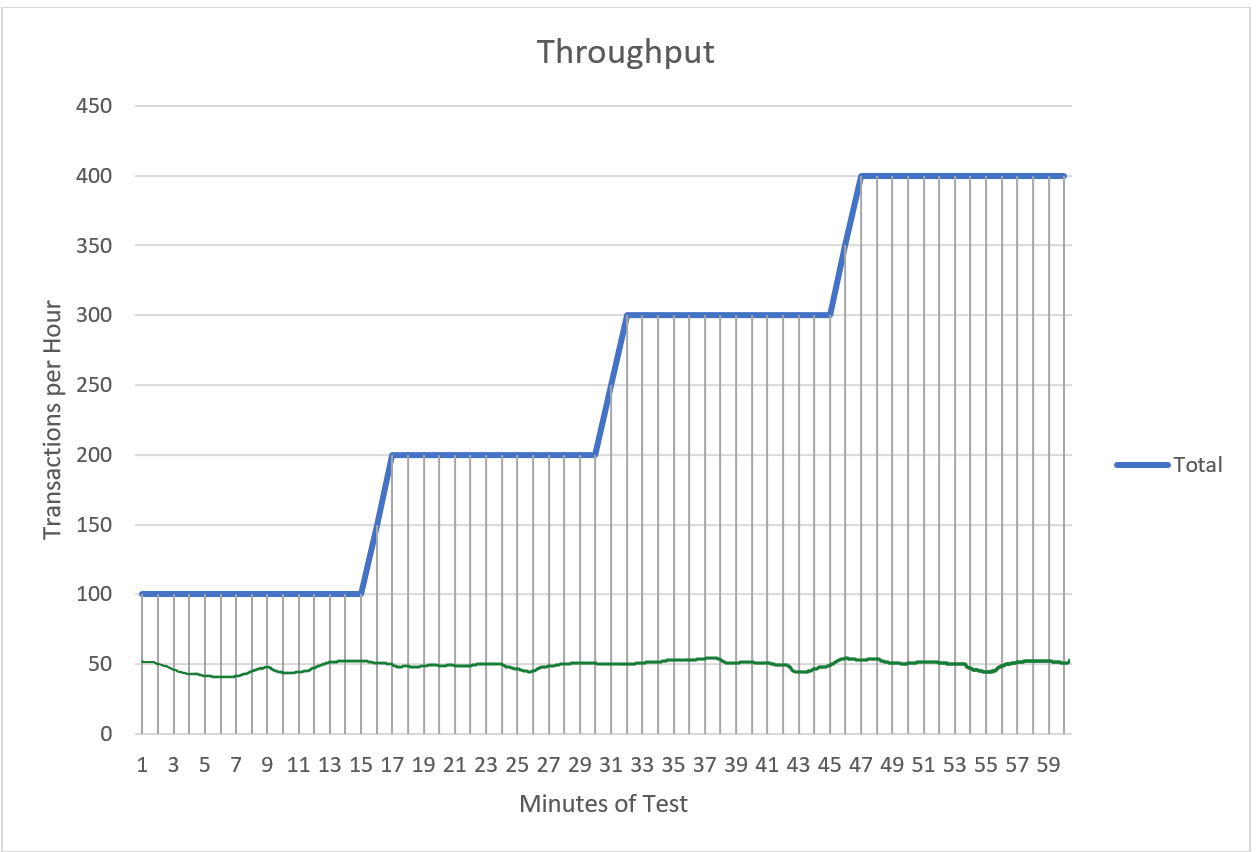
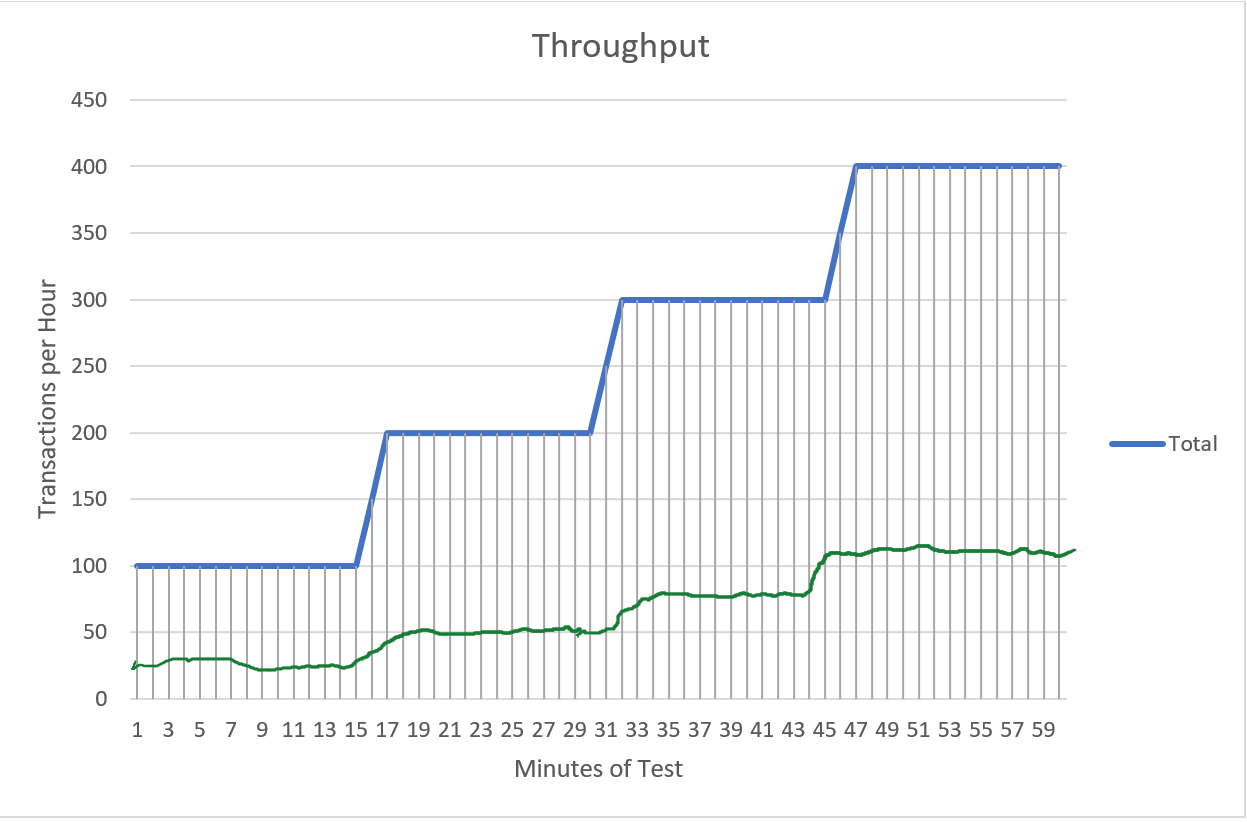
There are a few different things that response times can do during this scenario: stay constant, increase linearly, increase logarithmically. Consistent response times tell me that the application can handel much more load than what we are running. Linear response times show that the application is starting to queue but not so much that it is past the point of failure. Logarithmic growth shows that the is substantial queuing happing somewhere in the application and the increasing response times are adding to that.
Analyzing Throughput
When analyzing throughput, you should see a steady linear trend. Actual throughput should increase at the same rate of scheduled throughput from the test rig.
Putting it together
To determine how the application is performing under varying degrees of load, analyze the response times and throughput of this scenario. This should explain how the application will respond in a real-world production environment with fluctuating load.
Some great places to use this type of scenario would be in predictable workload applications. It is a great baselining tool that can provide multiple points of analysis that you just can’t get from a standard consistent load scenario and prevents the data skewing associated with a max capacity scenario.
Exceptions to this scenario
This scenario will not work well for applications that have large spikes in throughput.
This scenario will not typically tell you the maximum capacity of the system (Unless the application tips over during one of the load levels)
Example 1 – Consistent KPI:
Example 2 – Linear KPI:
Example 3 – Logarithmic KPI: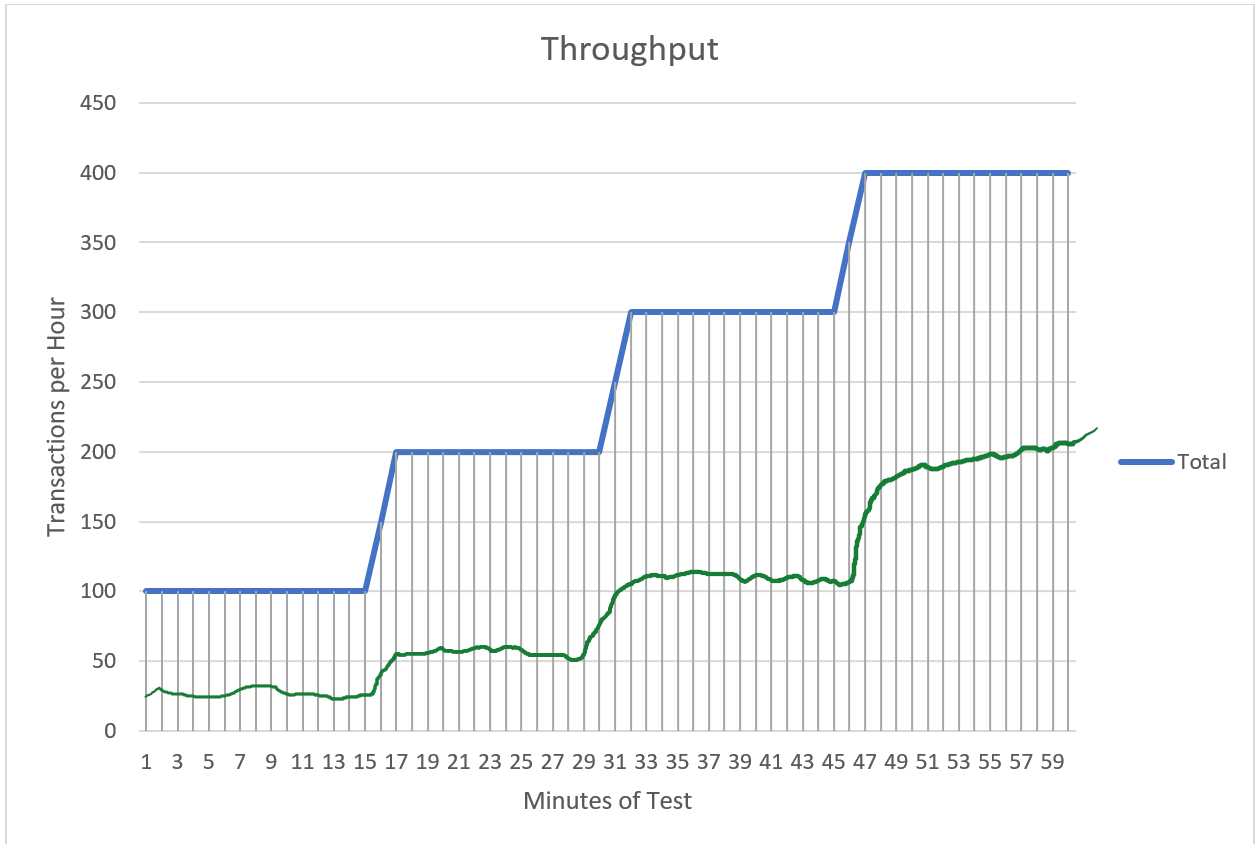
KPI – Key Performance Indicator (Response Times, Throughput, Error Rate, CPU, etc.)