Effective Techniques and Tools for Reducing Leaks in .NET (C#)
But .NET does not allow you to leak??? It's got garbage collection and what not. L
Sadly, there simply is no mechanism that will give you the flexibility you need, allow you to interoperate with existing legacy code, and allocate and de-allocate handles, memory, and other resources at will without paying a tax.
Since I get this question a lot, I thought I would list here are a number of tools and techniques that you can use in your quest to rid your software of leaks.
Use Coding Standard and Best Practices
Create coding standards and a set of practices for your team that help build clean code to start with. It is much easier to design problems out of the system than it is to find the bug, fix it (without breaking something else), and ship this to your customer. Some of the things you can do are:
Require the use of IDisposable pattern for any objects that themselves hold references to IDisposable objects. Require that the creation of objects that implement IDisposable use the "using" clause around all such instances.
There are a few instances where doing this will bite you. But, if you use delegation, you can usually wrap these calls in a way that allows you to use the "using". Or, you can simply make sure that when it's not used, that it is clearly documented in the code and there is a clear plan for disposal of the object. For example, in the first case I listed above, an object holds a reference to an IDisposable object. In this case, the clear plan it to have the owning object cleanup (dispose) of the owned object(s) during its IDisposable call.
Use the language features (like the new "async" and "await" features in C#, and the new threading items like Task) to help simplify multi-threaded code.
Require everyone who touches, thinks about touching, has and opinion about or otherwise interacts with the code in any way read these items:
I also recommend Advanced .NET Debugging and Advanced Windows Debugging. However, getting folks to read these books might be hard, as
Test Driven Development
Debug every line of code you write as you write it. I use unit tests, which I write prior to the code to help me step through the various scenarios for each method. I do not trust myself to get Boolean expressions correct. Instead, I step through the code and make sure my assumptions were correct.
If I make assumptions in the code, I write defensive code. I only throw when something goes wrong. I only catch if I know what I am catching, and know what to do with what I caught. Of course, I bend this to perform logging, but then immediately re-throw.
I use asserts for when I am debugging code, and I cannot write defensive code (usually due to time constraints) to protect the function. Ideally, these asserts are "to do's" to go back and add defensive code later when I start getting bug reports in the area.
"Break hard fast"
This is my slogan for development. I learned this through the school of hard knocks. This may not be intuitive to most, but this basically means that when writing compiled code like C#, you want to leverage the compiler type checking and static analysis to get rid of the bulk of you bugs. When that fails, and you make it to runtime, you want your code to fail as close to the time you write the code as you can. And, you want it to be something that blocks you until you fix it. Fixing a bug as you are writing the code allows you to alter the design before the code is in-place, lets you solve the problem while the problem is still in your head, and allows you to quickly give up on poor designs before others become dependent on them.
Detecting Leaks
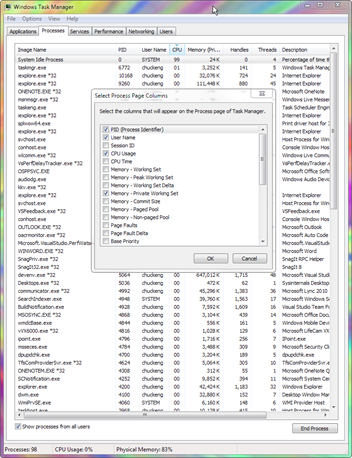
Basic resource leak detection can many times be done by using Windows Task Manager. Just add the appropriate fields to the Process view. Then perform the scenarios you are concerned about over and over.
You can also use Performance Monitor. Visual Studio provides access to the Performance Monitor data inside Visual Studio to observe process memory, timing, etc. (Access it from the menu View -> Other Windows -> Performance Explorer.)
Additionally, Mark Russinovich's SysInternals tools (now owned by Microsoft), are great for detecting, and sometimes drilling into issues. For example, Process Explorer is an even better version of Task Manager. It allows you to get callstacks (if symbols are setup correctly), create dumps (well, ok, Task Manager does this too), search for paths to find handles to files, look at the guts of a process, etc. There are many tools in the Suite, so you should check them out.
These tools help you to detect the problem. But you will need to go deeper to find the offending code and fix the issue.
Writing Profiling Code
You can write profiling code in your application to take snapshots. You can use tracing, performance monitor APIs, other Windows eventing APIs to track resource usage, or use some combination of the above to monitor your app as it runs. This is of course harder. And, it is much easier to design this into the software when you are first building it, than to add it later.
I recommend designing performance requirements into every API. This does not mean that the developer has to write any code for performance. Many times, the code they write just works and it is fast enough. But, how do you know if it is fast enough? This is where the requirements will help.
The same thing applies to the use of resources. When you create a design, determine what is acceptable or allowed for the process/thread/or object to consume. This works better when you use a holistic view for an entire application than when you are in the details of an API. But, you apply the limits when you are testing the APIs to make sure they comply with the requirements. Note that you may need to specify what can be used for short durations versus long durations. And you will likely need to determine what the right set of durations are.
The Debugger
The debugger is your friend. Whether you prefer the Visual Studio debugger or WndDbg, you can successfully find leaks and get straight to the problem at hand using a debugger. For .NET code, you will need to load and use SOS. (https://madgeek.com/Articles/Leaks/Leaks.en.html#SOSAndWinDbg). This allows you to look at the managed memory, etc. It is something of a "ninja" approach to leaks, but once you learn the skills you need, you will be an ace wherever you work. J
And hey, you are already stepping through every line of code in the debugger as you write it, right? So, while you are there, you can check for leaks and other issues.
Using a Profiler
In Visual Studio Ultimate and above, you can also is the .NET Memory Profiler. I want go into a lot of details here, as there are already a lot of articles on the subject. (See the bottom of this post if you need more to read.)
Of course, there are many partners that provide paid tools (which are many times better than the ones we provide). To name only a few: JetBrains, MicroFocus DevPartner, and RedGate Software.
More Articles on Leaks, Performance, Multi-Threading, etc.
There are lots of articles on performing leak analysis. Many are geared towards specific things. Not all techniques work for all types of problems. So, determining while you are not releasing a handle can be way different than why your memory keeps climbing.
Here are general articles that I found useful:
https://msdn.microsoft.com/en-us/magazine/cc188781.aspx
https://msdn.microsoft.com/msdnmag/issues/1100/GCI/default.aspx
https://msdn.microsoft.com/msdnmag/issues/1200/GCI2/default.aspx
https://msdn.microsoft.com/msdnmag/issues/01/12/hood
https://www.codeproject.com/KB/dotnet/Memory_Leak_Detection.aspx
https://channel9.msdn.com/Shows/Going+Deep/Mads-Torgersen-Inside-C-Async
https://msdn.microsoft.com/en-us/magazine/cc337887.aspx
Hope this helps…