Walkthrough: Profiling With Automated Tests
When doing performance investigations, we recommend having some well-defined scenario in mind in order to increase the reproducibility of your issue and increase the consistency of profiling data collected. This approach is similar in spirit to creating the smallest self-contained repro possible when debugging. When diagnosing any complex system, limiting the variables involved is a key step to discovering a solution.
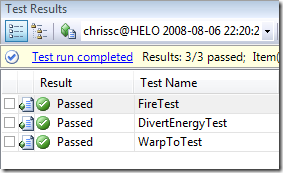
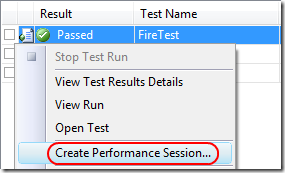
Automated testing can often lead to naturally self-contained scenarios. Integration tests ensure the correctness of a subsystem as its separate components work together. If you test large portions of your application in this manner frequently enough, it is possible to catch performance issues and regressions before they become too serious. With the profiler and test integration added in VS2008, once you notice a regression, you can create a performance session directly from the slow test via its context menu:
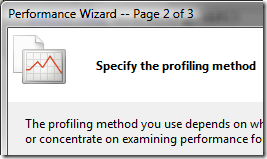
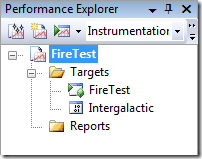
This will lead you to the Performance Wizard where you must decide between instrumentation and sampling. Which method you should use depends upon the type of application you’re profiling and the kinds of questions you’re trying to answer. Once you’ve completed the wizard, you’ll get a shiny new performance session ready to be launched. You’ll see below that, in this case, our primary project and profiling target, Intergalactic.exe, is marked for instrumentation while the unit test is what we’ll be launching.
After launching the profiler, the test will execute as normal, exercising your code under the profiler. The benefit of this approach is that reproducibility is maximized since the scenario is defined in code. After the test completes, you’ll get a performance report to assist you with further investigations.
Performance sessions can be created from unit tests, web tests, database tests, and load tests containing web tests. Load test and web test profiling will only work if you’re running against a web site or web service hosted locally in IIS or Cassini. The reason for this limitation is that the profiler must run on the same physical machine as the target process in which you’re interested. If you must profile a web site or web service running remotely, try using the command-line tools included in the standalone profiler, referring to this blog article for guidance.


