Create your own visualizations for SharePoint Workflows built with Visual Studio and Visio
SharePoint Designer has the capability to generate Visio diagrams for the workflow history page that display status of the executing workflow, unfortunately Visual Studio does not do this for workflows that are created and deployed to your farm.
Ah, not generated for you but you can certainly create your own manually, and it is very easy to do…
- Create your workflow in Visual Studio and deploy it to your site. Make sure to test it. You probably already have this for your existing workflows.
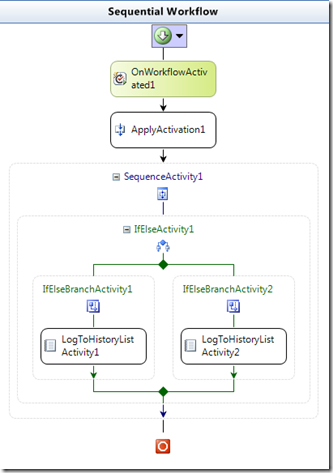
This is a simple workflow that checks a property and logs one of two different items to the History list based on the property comparison. - Create a new diagram in Visio 2010 Premium using the SharePoint Workflow template. Make this diagram mimic as close as possible the workflow that you have designed in Visual Studio.
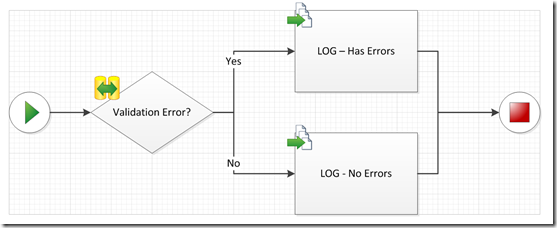
You want to have a shape in the diagram for every action that you care to see status for.
Don’t forget to add some flair like background graphics, themes, etc. - Use the Export feature to create the VWI file format that is used by SharePoint Designer, however we will not be using it with SharePoint Designer.
- After you export the VWI file you also need to save the diagram using the Web Drawing (VDW) file format.
- Go back to Visual Studio and add a new Module to your workflow solution.

Name it VisioDiagram ( or whatever you want )
Delete the Sample.txt file from the module folder
Edit the Elements.xml file and change the file path to point to the VDW file instead of the sample.txt file.
<File Path="VisioDiagram\DiagramValidation.vdw" Url="VisioDiagram/DiagramValidation.vdw" />Edit the Elements.xml for the Workflow

and add the following nodes…
<ShowPreview>true</ShowPreview>
<PreviewHref>VisioDiagram/DiagramValidation.vdw</PreviewHref>I add these right after the <AssociationCategories> node but I do not think it matters as long as they are both in the <MetaData> node.

The final step is to tell each item in the workflow which shape represents it in the diagram. This is where the VWI file comes in.
Rename the .VWI that we exported earlier to .ZIP and open it. You will see a few files in the zip container but we are only interested in the .XOML file. Extract and open the .XOML file in a text editor.

I usually extract the .XOML file and rename it to .XML and then open it in IE or my favorite XML editor. This makes the XOML easy to ready and navigate.
In the Text Editor look for something that looks like this…
Description="ShapeGuid={BF5D5F2C-E1DB-4E3A-8CEF-8BCCEFE6DFFD};PageId=0;ShapeId=4;"
This describes the shape on the page. Copy the information inside the quotes and paste that right into the Description property of an activity in Visual Studio that you want associated with that shape.

You will need to do this for every shape that you want to link to your workflow activities. This could be the most time consuming part of the process as you need to match these shapes up with the right activities in the workflow or the status icons will display on the wrong shapes.
Build the Solution and Deploy the solution to your farm.
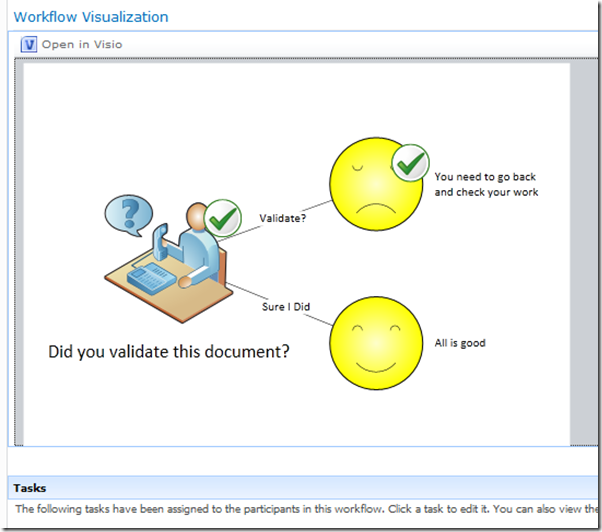
Test the workflow and when you go to the Workflow History page you should see the diagram as well as little status icons displayed on the appropriate shapes.
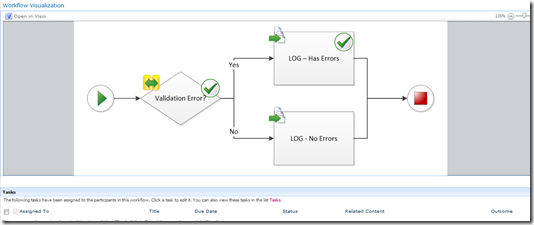
But what about something a little more custom
In the previous steps I had you use the SharePoint Workflow template to create a diagram that looked similar to your workflow in Visual Studio. This does two things:
- It gives you visual context to help you map shapes to activities so the status icon gets added on the workflow visualization
- It generates the XOML file that you mine the Shape GUID and ID from
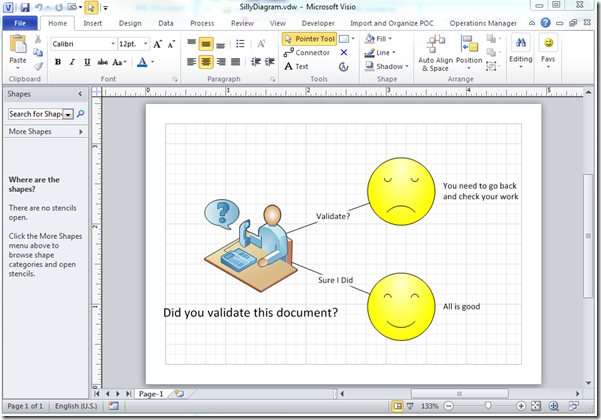
Well Visio will give you a GUID and an ID for any shape on the page. So why not just create any old diagram and use that for your workflow visualization? Like this…
All we need to do is
- save this to the VDW file format and use it in the VisioDiagram module that we created earlier in our Visual Studio project.
- Figure out the GUID and ID for each shape and add that to the Description property of the workflow activities just as we did before using the format
ShapeGuid=X;PageId=0;ShapeId=Y;
- where X is the Shape GUID and Y is the Shape ID
To get the Shape ID
- Select the shape in the diagram
- On the Developer tab click on the Shape Name button
- Right at the top of the Shape Name dialog you will see the ID

In this case 3
To get the GUID is a bit trickier
Open the VBA Editor
In the Immediate Window type and execute this code
?ActiveWindow.Selection(1).UniqueID(visGetOrMakeGUID)Which returns the GUID of the shape…
{B31D9AE2-A668-400E-ACA7-C1EFE5B2457C}
Note to get all the GUIDs you will need to switch back to the diagram, select another shape, and then switch back to VBA and run the same code. If you do this all the time you might want to just write a macro that spits it all out for you in the right formatNow take these two values and create the value for the Description property
ShapeGuid= {B31D9AE2-A668-400E-ACA7-C1EFE5B2457C};PageId=0;ShapeId=3;
and copy it to the activity’s Description property.
Once you get all the Description properties filled out correctly you can then build and deploy your workflow solution and when executed you should see the status icons over your custom diagram.

