Steps to Create Dump files of a Process with DebugDiag when Any .net Exceptions are thrown
[Update: These steps were written for DebugDiag 1.2 but can be readily adapted to DebugDiag 2.0. Download DebugDiag 2.0 from https://debugdiag.com!]
When I want to get a memory dump of any and every exception that a process might throw while quickly reproducing a problem, these are the steps I tend to use.
Warnings: If you do attempt to create process dumps when any and every .net exception is thrown, there is a slight possibility that you could make your server so unresponsive that you may have to cold boot it from the data center to recover. This might depend on how many exceptions are being thrown. I recommend you start with the instructions in the previous blog (Steps to Log all .net Exceptions to a Log file with DebugDiag 1.2)to merely log the exceptions to a log file first before you consider proceeding to make dumps for all exceptions. If you see less than ten exceptions in the log file when reproducing the problem you are troubleshooting, you could consider dumping all of those exceptions to a dump file if you're not sure which specific exception to focus on. Also beware of running out of free disk space.
Launch Debugdiag from the Programs Menu
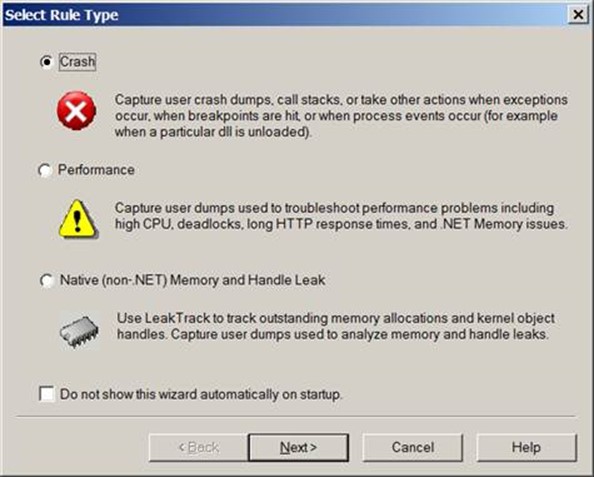
Select "Crash" as the rule type
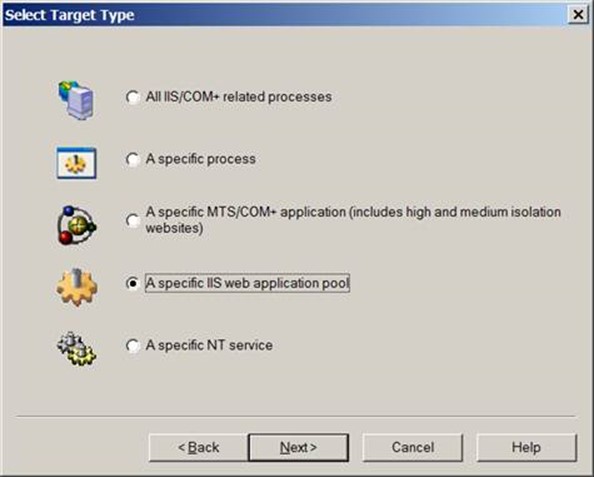
Assuming you're troubleshooting a problem that is occurring in an IIS/ASP.net process, try to select
"A Specific IIS Web Application Pool"
If you know which application pool to focus upon.
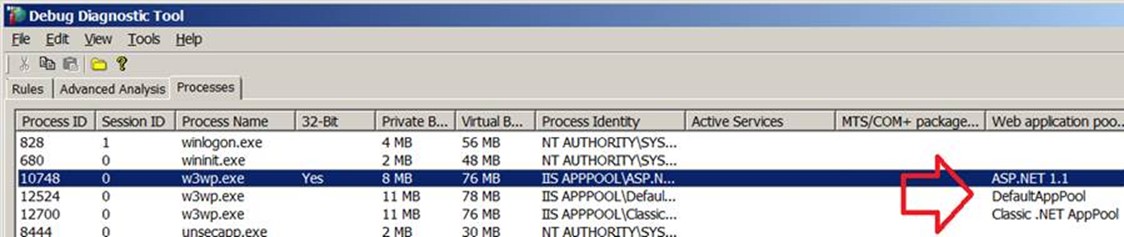
If you need to figure out which w3wp.exe matches which IIS Application Pool,
you can visit the processes tab of DebugDiag to get this information.
If you're not sure which IIS process to focus on, you can select
"All IIS/Com+ related processes."
If it's not an IIS process but another process throwing .net exceptions, you can select
"A specific process"
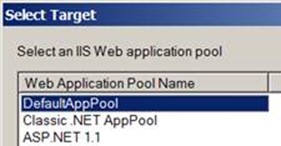
In this demo I'm selecting a specific AppPool and clicking Next.
Select the AppPool to focus on and click Next again
Select the Exceptions button
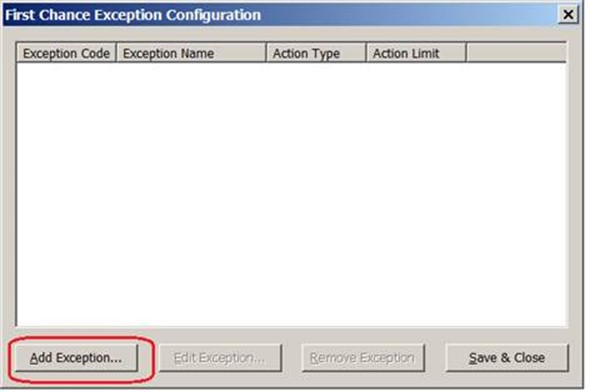
Select the Add Exception button
Optional: Remove any exceptions that may have been set up earlier.
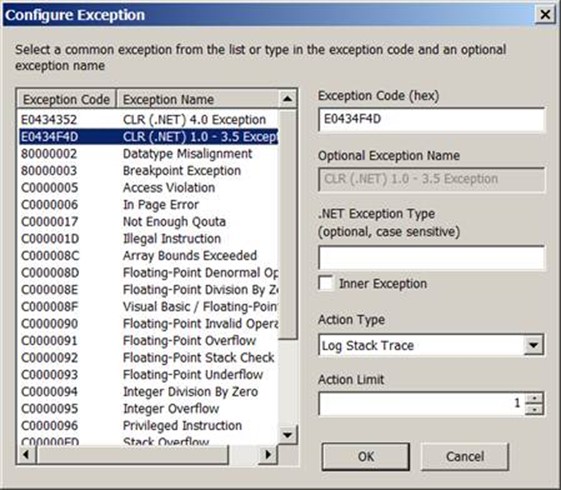
Highlight the Exception Code E0434F4D in the left pane.
This assumes that the web application we're troubleshooting is written in asp.net 2.0, 3.5, 1.1 or 1.0.
(But if it's asp.net 4.0, select the E0434352 code of course.)
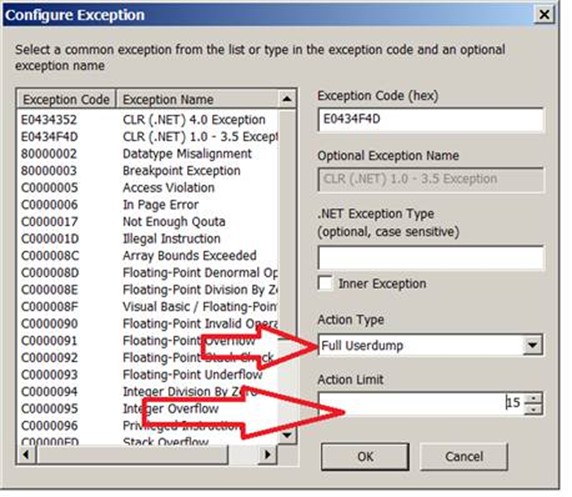
Set the Action Type to: Full Userdump
Set the Action Limit to: 15 or fewer
(do you have enough freespace? Are you ready for the server to get bogged down temporarily?)
Click Save and Close button
Click the "Save and Close" button.
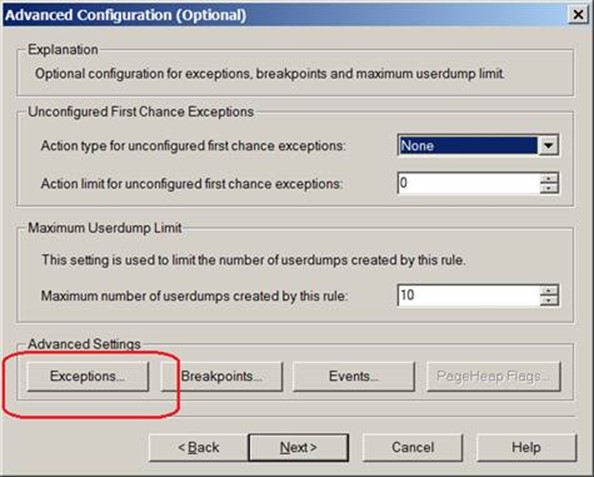
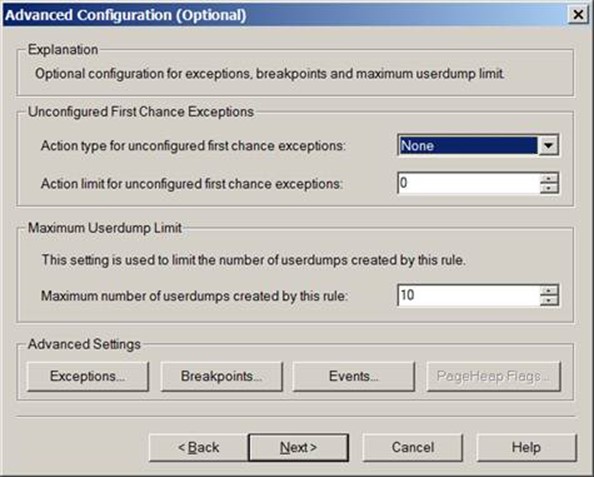
On the Advanced Configuration (Optional) window, simply click NEXT.
There is no need to make changes here.
Maximum number of userdumps created by this rule could limit you to 10 dumps total.
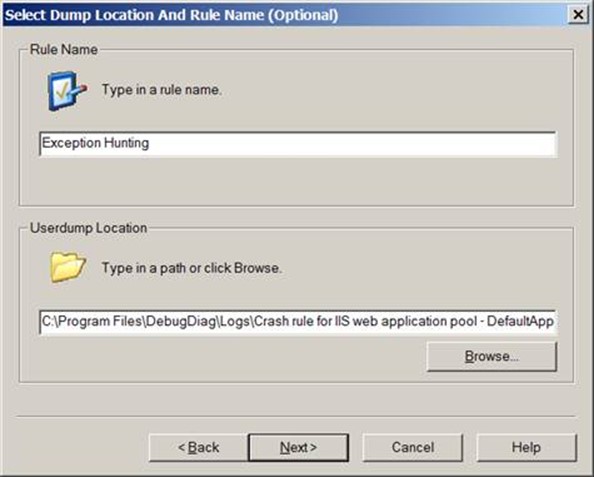
On the Select Dump Location and Rule Name window, feel free to change the rule name and the userdump location.
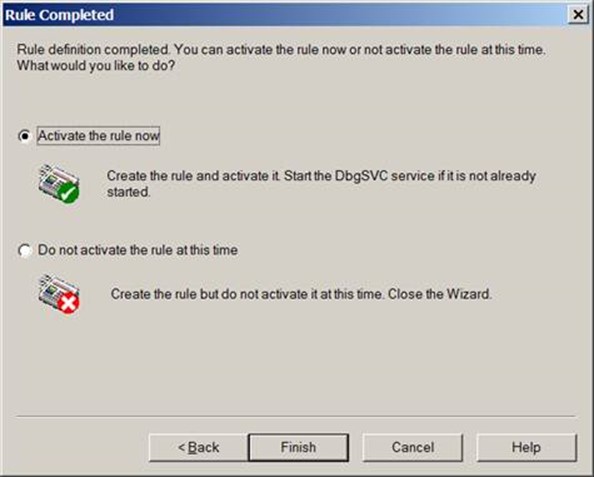
On the Rule Completed window, you have a choice on whether you're ready to activate the rule or not.
If you're ready to reproduce the problem (one or two mouse clicks away) then activate it now.
Otherwise select "Do not activate the rule at this time" for now and activate it later.
Click Finish.
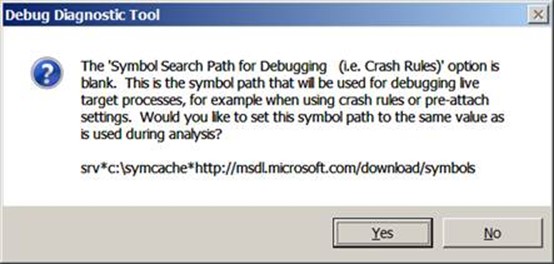
If you see this message about Symbol Paths, you can select YES.
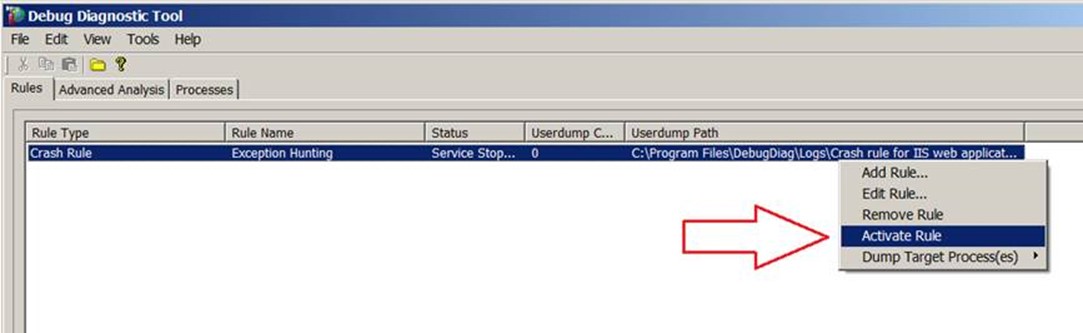
Assuming the rule was not activated upon rule finish, you can activate the rule when you are ready to reproduce the problem.
If possible, activate the rule when you are one or two mouse clicks away from reproducing the problem.
Also, if possible, reproduce the problem in a test environment rather than in a production environment.
If you do reproduce the problem while logging exceptions with DebugDiag, try to reproduce the problem when traffic to the application pool or process that you're monitoring is at its lowest levels.
Whenever an CLR/.Net exception is thrown inside of the selected process, debugdiag should create a memory dump of the process being monitored when any .net exception is thrown. If you reproduce the problem and five exceptions are thrown, you should expect to see five dump files created. There is very possibly going to be some unnecessary redundancy with this method if several dumps are created.