Debug messages and debug zones in Windows CE
Posted by Travis Hobrla (thanks to Sue Loh who assisted with many portions of this article)
Introduction
Debug messages are an excellent supplement to a debugger. They give information about the system’s state, warn about potential failures, and assist in understanding order of execution. Of course, you could use the debugger to get that information, but debug messages offer a quick and concise presentation. They’re a great tool for making a first diagnosis so that you know where to dig deeper. Good messages often identify the problem immediately, which can save you a lot of time.
RETAILMSG and DEBUGMSG
There are two main flavors of debug messages in Windows CE: RETAILMSG and DEBUGMSG. These are macros that print a message to the default debug output stream – typically this is the debug output window in Platform Builder. The DEBUGMSG flavor is used in debug modules only. So, modules compiled as retail (i.e. compiled with wincedebug=retail set in the build environment) will not output any DEBUGMSG statements. RETAILMSG, on the other hand, is printed in both retail and debug builds. If the build is compiled as a “ship build” (winceship=1), no messages will be printed.
Debug Zones
Windows CE uses “debug zones” to control which DEBUGMSGs get printed, while RETAILMSGs are generally always printed and don’t use “debug zones”. Each CE module (a .dll or .exe) has its own separate “debug zones”. If a zone is active, messages for that zone will be printed. If a zone is inactive, messages for that zone will be suppressed. The dpCurSettings variable is a global variable in each module that controls which zones are active. It’s typically only compiled in if the module is being built as debug.
dpCurSettings contains a name for the module, names for up to sixteen zones, and a dword mask (ulZoneMask) indicating which zones are currently active. The module and zone names are simple Unicode strings. The mask’s low 16 bits control one zone each. So, if you wanted to enable only the sixth debug zone, you would set bit 6 of ulZoneMask to 1, like so:
dpCurSettings.ulZoneMask = 0x20;
Let’s take a look at an example dpCurSettings from the PCI bus driver (public\common\oak\drivers\pcibus\pcibus.c):
DBGPARAM dpCurSettings = {
TEXT("PCIBUS"), {
TEXT("Errors"),TEXT("Warnings"),TEXT("Functions"),TEXT("Initialization"),
TEXT("Enumeration"),TEXT("Load Order"),TEXT("Resource"),TEXT("Undefined"),
TEXT("Undefined"),TEXT("Undefined"),TEXT("Undefined"),TEXT("Undefined"),
TEXT("Undefined"),TEXT("Undefined"),TEXT("Undefined"),TEXT("Undefined") },
DBG_ERROR | DBG_WARNING
};
In this case, our module name is PCIBUS, and we have 7 zones with names like Errors and Load Order. The very last variable, DBG_ERROR | DBG_WARNING is the mask telling us that the Errors and Warnings zones will be active by default. What are the values of DBG_ERROR and DBG_WARNING? Since “Errors” is the first debug zone, DBG_ERROR is 1 (the first bit set to 1). “Warnings” is the second zone, so DBG_WARNING is 2 (second bit set to 2). These two values are combined with |, so our ulZoneMask has a default value of 3.
The actual DEBUGMSG macro has two parameters: first, which zones it is associated with, and second, the actual text of the message (which is compatible with most printf syntax). Here’s an example:
DEBUGMSG(ZONE_ENUM, (L"PCIBUS!PCIRegClean %d devices to check\r\n", NumDevKeys));
This message will be displayed if ZONE_ENUM is set. Since ZONE_ENUM isn’t set by default (we’ll go over how to set it later), we won’t see this message. This saves us from having to dig through tons of debug messages that we don’t want.
Changing Debug Zones
How do we choose which debug zones are enabled and disabled? There are actually several mechanisms built in to Windows CE. Here’s a summary of what Windows CE looks for to determine which zones are active for a particular module, and what you need to do to change each:
1. The initial (hard-coded) state of dpCurSettings.
To change this, you need to modify the module code and recompile (and make sure the newly compiled module is in your image or downloaded using the “Release Directory Modules” feature).
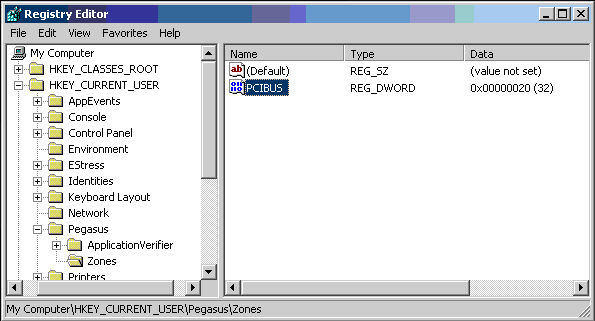
2. Host-side (desktop) registry: [HKEY_CURRENT_USER\Pegasus\Zones]:Module Name
The magic “Pegasus” key is probably the easiest way to change zones before module load. Since it uses the host-side registry, you won’t need to make any changes to your CE image. If you’re wondering why “Pegasus”, well, it is my favorite type of flying horse. It’s also the codename for a very old version of Windows CE, and some references to that name are still around today. Anyway, to change debug zones through the desktop registry, add a dword value to this path with the Module Name of dpCurSettings, and value equal to the zone mask you want. For example:
3. Client-side (device) registry: [HKEY_LOCAL_MACHINE\DebugZones]:Module Name
To change this, modify/add a dword value to your device registry in a similar fashion to the above (#2).
4. The value of dpCurSettings in RAM.
There are a few ways to modify dpCurSettings dynamically in RAM.
In run state:
The CE Debug Zones in Platform Builder (Target->CE Debug Zones) will give you a list of modules and zones which you can change. You can also use the ‘zo’ command in the shell (Target->Target Control) to modify the zones. Running ‘?’ in the shell gives you a good description of how the ‘zo’ command works.
The undocumented SetDbgZone API can also be used from running code as follows:
DBGPARAM dbg; // OK uninitialized, receives new settings
SetDbgZone(hProcess, hModule, 0, dwZone, &dbg);
Use hProcess=0 if you're controlling a DLL; use hModule=0 if you're controlling a process. You’ll probably have to use ToolHelp get the hProcess or hModule value.
In break state:
When execution is halted you can modify the value of dpCurSettings right in the debugger. The easiest way to do this is to open a watch window (Debug->Windows->Watch) and set a Watch for {,,mymodule.dll}dpCurSettings.
When a module loads, Windows CE checks options 1, 2, and 3 in order, with higher numbers having higher precedence. So after the module is loaded, changing 1, 2, or 3 won’t accomplish anything. The most recent in-RAM modification (option 4) will obviously take precedence over all of these.
Warning: don’t change a module’s debug zones to 0xFFFFFFFF! This actually causes the kernel to “echo” the current zones. If you want to enable as many zones as possible, use 0x7FFFFFFF instead.
Adding Debug Zones to your module
Adding debug zones to your own module is very easy. First, include dbgapi.h, then define dpCurSettings in the same fashion the PCI bus driver did above. Finally, call DEBUGREGISTER(dllInstance); when your module loads.
To make it easy for you to reference your debug zones without having to do bit-shifting magic, CE provides the DEBUGZONE macro to do the shifting for you. Here’s an example from the PCI bus driver (public\common\oak\drivers\pcibus\pcidbg.h) of the DEBUGZONE macro in action:
#ifdef DEBUG
#define ZONE_ERROR DEBUGZONE(0)
#define ZONE_WARNING DEBUGZONE(1)
// ... etc.
#endif
Note that these are defined in a header so that any part of the PCI bus module can use them. Once you’ve defined your zones with the DEBUGZONE macro, you can use && and || to control them. In some cases, it’s nice to add a ZONE_VERBOSE to turn off the less important output for other zones. Here are some examples:
// Print a message if ZONE_STUFFABOUTBLOGS is turned on
DEBUGMSG(ZONE_STUFFABOUTBLOGS, (TEXT(“I really like blogs.\r\n”)));
// Print a message if both zones are turned on, verbose info about blogs
DEBUGMSG(ZONE_STUFFABOUTBLOGS && ZONE_VERBOSE, (TEXT(“And I really mean that!\r\n”)));
// Print a message if either zone is turned on
DEBUGMSG(ZONE_STUFFABOUTBLOGS || ZONE_STUFFABOUTCATS, (TEXT(“I really like blogs and cats.\r\n”)));
Pretty simple, huh? With only this and a definition of dpCurSettings, you can use debug messages in your module as well. Because ulZoneMask is a dword, you can actually create up to 31 zones (remember that last bit is reserved for the kernel), but only the first 16 can have names due to the layout of DBGPARAM.
Retail Zones
The RETAILMSG macro is typically used just like the DEBUGMSG macro with the condition always set to true, like so:
RETAILMSG (1, (TEXT("WriteData: failed to erase block (0x%x).\r\n"), dwBlock));
But provided that dpCurSettings is defined for a retail build of your module, you can actually use debug zones with retail messages as well – though most modules don’t do this. Follow the same steps as the above, omitting the #ifdef DEBUG’s, and instead of calling DEBUGREGISTER(dllInstance), call RETAILREGISTERZONES(dllInstance). Or you can directly call the RegisterDbgZones() function which these macros wrap.
Conclusion
Hopefully now you have a good grasp on how debug messages and debug zones work in Windows CE. In a later post, I’ll talk about a couple special modules (particularly relevant to BSP developers) that behave differently when it comes to debug messages: the OAL and KITL.
UPDATE Nov. 10 2008:
Q: Can I use debug zones in my application when I'm not using Platform Builder?
A: Yes, if you define dpCurSettings and register it with RegisterDbgZones() you'll be able to declare zones in any module. You can control these using the device-side registry or SetDbgZone() as mentioned above. The DEBUGMSG/RETAILMSG macros should also be available in our SDKs. All of this is available in dbgapi.h which you should be able to find and look through if you have any Windows CE / Mobile SDK installed.