Visual Studio Code: Debugger for Chrome extension
In this post I am going to discuss one more cool extension for Visual Studio Code that unlocks web sites development capabilities – Debugger for Chrome extension.
Some of my Favorite Visual Studio extensions, from a Tech Evangelist
This extension allows you to launch and debug your web sites directly from Code using Chrome Debugging service. As you know, Visual Studio Code integrates with Node.JS and supports debugging there. But once you finish developing the server side and need to develop and test the client side, it’s very important to have integration with a browser.
The extension is open source, and you can find it using this link on GitHub. But in order to install the extension you can use Command Palette window and execute Install Extension command. Once Code downloads the full list of extensions’ names, you can start typing Chrome in order to make the list shorter:
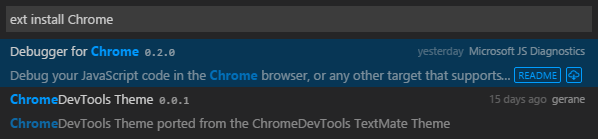
Just select Debugger for Chrome from the list in order to install the extension. Once you install it, you have to restart Visual Studio Code. So, simply click Restart Now button in a dialog that Code shows right after installation:

That is all, and you can start using the extension.
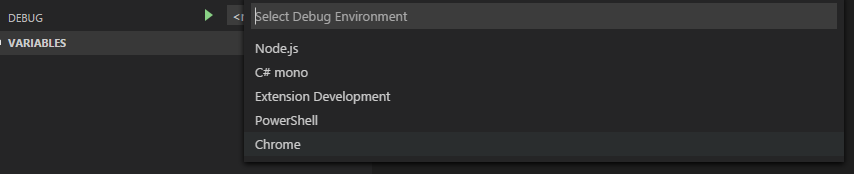
Like in case of Mono or Node.JS you need to create launch.json file that will provide information to Code about external debugger and entry point. It’s easy to do because extension’s developers implemented several configurations there. So, you can click Start button in Debug view and Code will propose to select the best configuration (Chrome, in our case):
You can see that launch.json contains three different configurations:
 {
 "version": "0.2.0",
 "configurations": [
 {
 "name": "Launch index.html",
 "type": "chrome",
 "request": "launch",
 "file": "index.html"
 },
 {
 "name": "Launch localhost with sourcemaps",
 "type": "chrome",
 "request": "launch",
 "url": "https://localhost/mypage.html",
 "sourceMaps": true,
 "webRoot": "wwwroot"
 },
 {
 "name": "Attach",
 "type": "chrome",
 "request": "attach",
 "port": 9222
 }
 ]
}
You can use the first one in order to run your site directly from Code. It’s the simplest way but it works fine if you have just the client side JavaScript/TypeScript code that you can open and test event without web server. If you need a web server to run your application, you can use the second configuration (just select it from the list in Debug view). A special parameter webRoot contains location of your files in your working folder which is very helpful if you have TypeScript code and compile it to a sub folder. But if your files are in the root folder you can simply remove this parameter. In both cases you should change file/uri to the correct one, providing a page that should be used as an entry point.
Finally, if you want to attach Visual Studio Code to Chrome, you can use the last set of configuration settings. But, in this case, you need to run your Chrome browser with an additional parameter that allows to provide and use the same port in Chrome and in Code. If you don’t do this, you will not be able to attach to a running instance. So, use the following command from Terminal:
/Applications/Google\ Chrome.app/Contents/MacOS/Google\ Chrome --remote-debugging-port=9222
Once you select the best configuration type, you can simply click Start once again and Code will open Chrome and activate Debug mode:
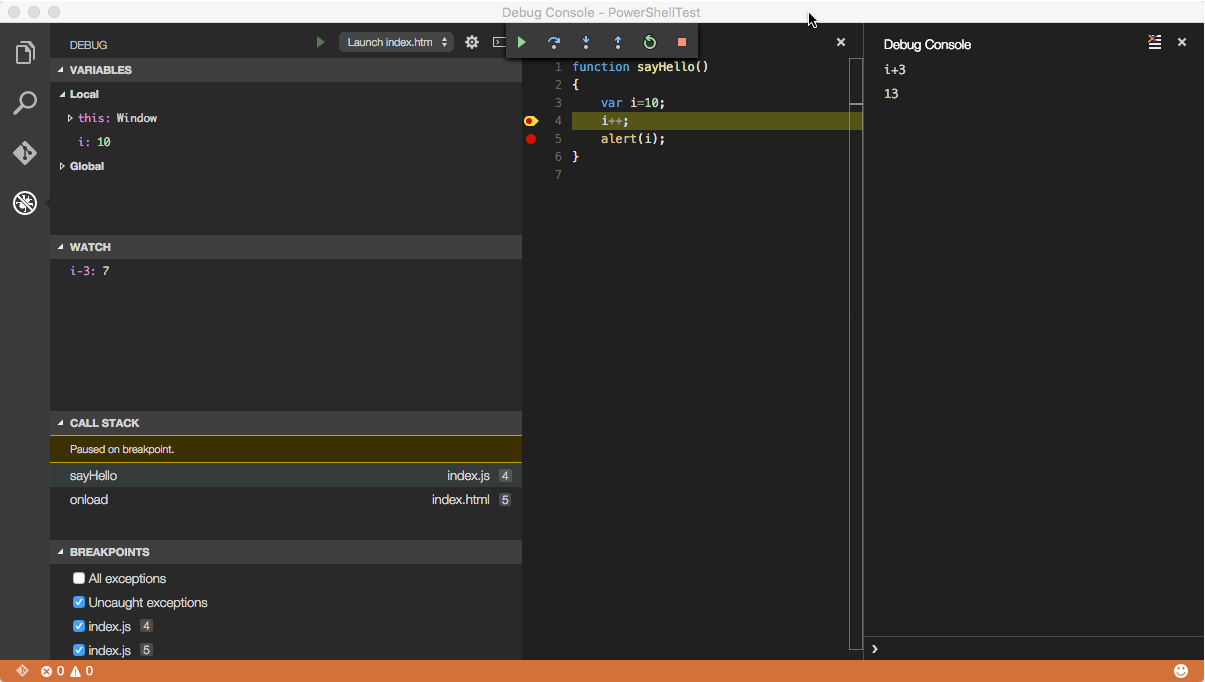
Working with the extension I discovered that it’s better to close all Chrome instances before starting a new Debugging session. And right after Code starts your Chrome browser, you may find that breakpoints on the main page have not fired. If it has happened, you can refresh the page and all breakpoints should be fired fine.
Finally, if you have some problems with running Chrome automatically, you can try two more parameters in launch.json like runtimeExecutable and runtimeArgs. The first parameter contains the full path to Chrome browser and the second one allows you to pass additional parameters, and we can use it to pass --remote-debugging-port=9222.
In general the extension is very useful and allows you to increase the speed of development, especially if you have two monitors and can edit, debug and execute code at the same time without restarting your browser or Code.