UWP: Profiling and debugging tools in Visual Studio 2015
I have already published a post about Live Visual Tree but Visual Studio 2015 has lots of different tools which allow you to tune your application on Universal Windows Platform. Let’s make an overview of some of these tools.
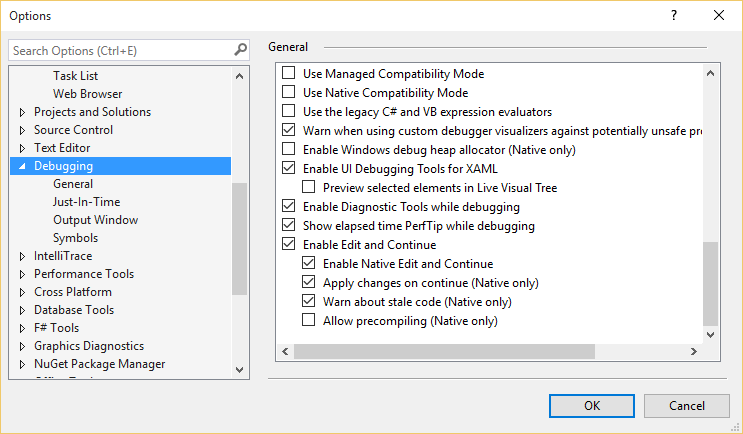
But before the start, just make sure that you switch the Enable Diagnostic Tools while debugging and PerfTip while debugging in the Debugging options. These tools should be enabled by default but it’s better to know how to disable/enable them:
Ok. Let’s talk about particular features, and I would like to start with the performance tips. Thanks to this feature you can use the breakpoints and debug mode to know exactly how much time has elapsed since the last breakpoint:
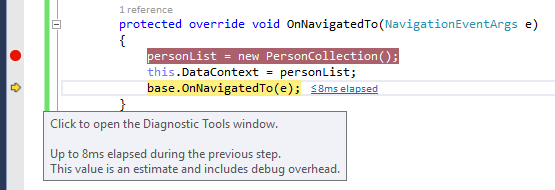
If you want to see this information for each line in your code you simply need to use debugger to go step by step through the code. But if you need to understand elapsed time for any of the blocks then you just need to set two breakpoints at the beginning and at the end of the block. So, using the performance tips you can easily locate problems with performance.
You can see that Visual Studio displays this information as tips and you can easily click these tips to navigate to Diagnostic Tools window, which is the second important tool which you can use together with performance tips:
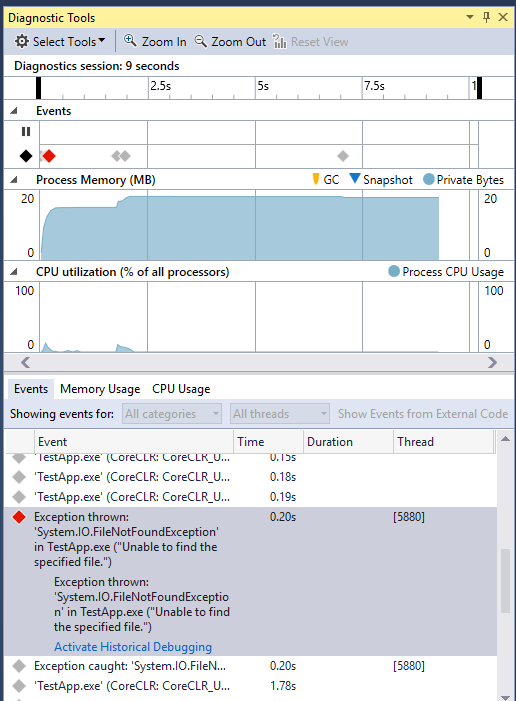
Diagnostic Tools contains three sections. The first one shows events like information about exceptions, even if exception is caught; messages from output window which are generated by the Debug class; IntelliTrace events related to threads, assemblies etc. The next two sections show CPU utilization and usage of memory at runtime but you can easily pause the debugger and select any timeframe in order to check events and memory and CPU usage.
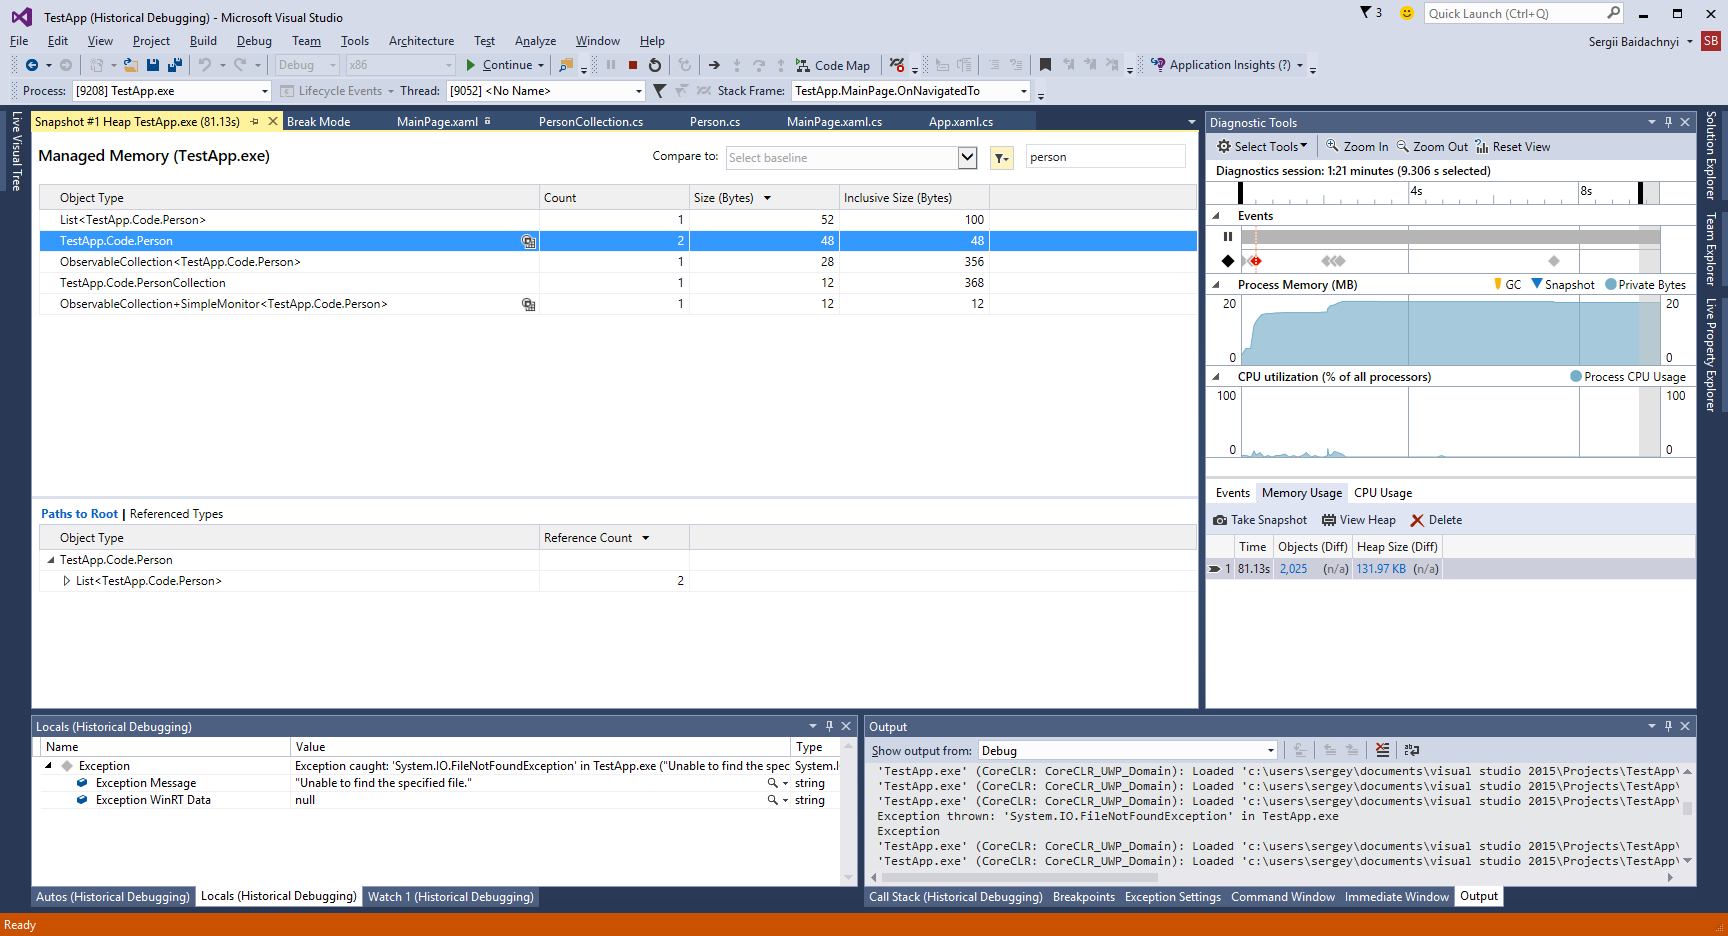
Additionally, you can take a snapshot of memory at any time during debugging of the application and check the number of references for each object, amount of memory etc.
The next set of tools you can find if you execute Start diagnostic tools without debugging… command.
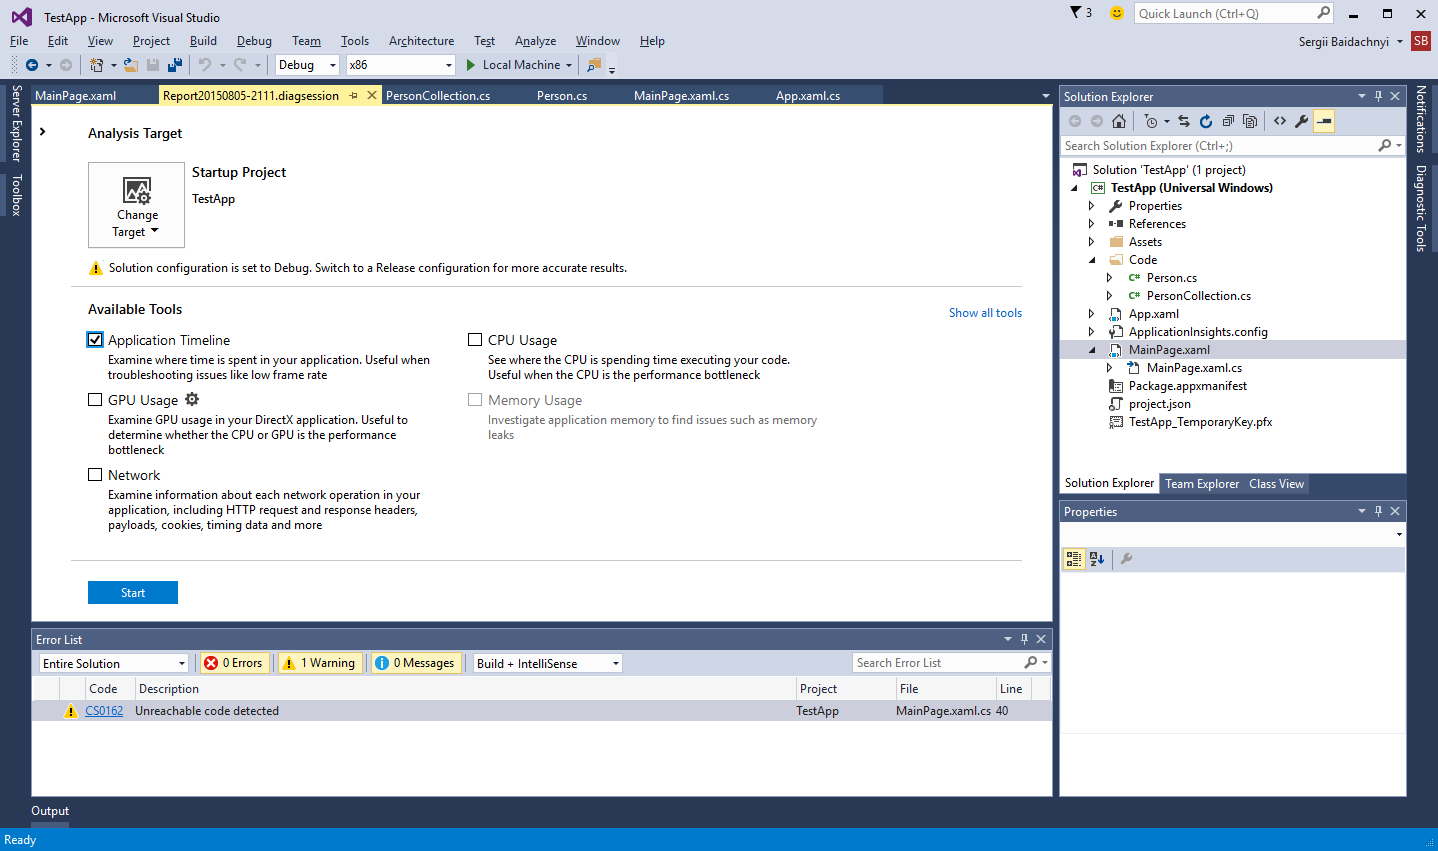
These tools allow to collect information during runtime. Because these tools collect all information not in the debug mode, these data has better quality but you cannot check it in real time. Instead, the tools collect information about application until you stop them. Once they are stopped, the report abound the collected metrics is generated and you can analyze the data using dashboard.
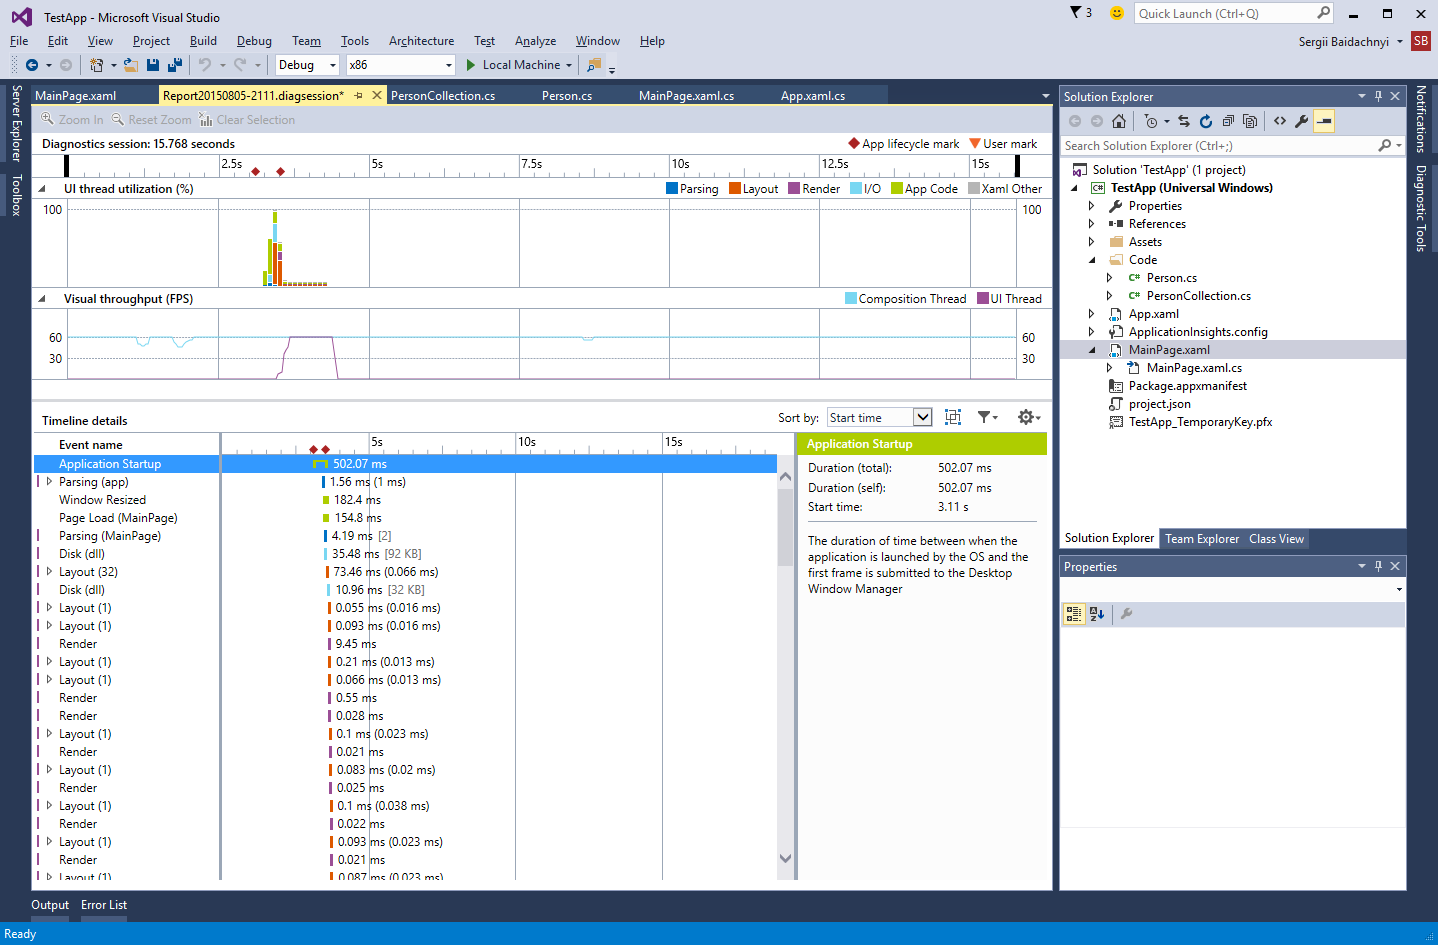
Among all tools I would like to recommend Application Timeline. Thanks to this tool you can find problems with rendering and review the most critical parts of your application.