Evolving ASP.NET Apps–Load Testing
The Evolving ASP.NET Apps series + bonus content is being published as a book. Buy it here.
In the last post, we made some big changes to the main bugs grid. Throughout that process, we made claims that our new approach would perform better than the previous implementation. In this post, we will do some detailed performance and load testing to compare the old and new approach.
Comparing Performance
Creating performance benchmarks is hard. There are so many variables that can affect performance that it can be nearly impossible to get consistent results. Difficulty aside, I made some claims that the original data grid implementation was not optimal and that our new implementation would be more efficient. I would like to at least attempt to prove this with some repeatable load tests.
Setting up the Environment
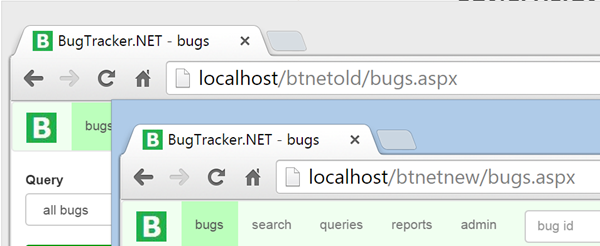
The first step is to create an environment were we can compare the performance of the old and new implementations. To do this, I switched back to the master branch to get a copy of the BugTracker with the original data grid implementation. I took a compiled version of this and deployed it as a web application on my local IIS. I called this application btnetold and assigned it to a new application pool by the same name. Next, I switched back to the Data_Grid_Update branch to get a copy of the new implementation. I compiled this version and deployed it to a web application called btnetnew, also with a new application pool by the same name. I now have the old and new applications installed into IIS. I am able to turn each version on/off by starting and stopping the individual application pools. Both instances are configured to use the same database instance which is also hosted on my local machine.
Original and new implementations installed locally
Designing the Tests
Before designing the tests, it is important to establish what exactly it is we would like to measure. My predictions are that the original implementation will require more CPU and more RAM to process the same number of requests. Based on what we saw in the code, I also predict that the CPU and RAM requirements will increase significantly based on the number of bugs stored in the BugTracker database. If all goes as planned, the new implementation should require a lot less CPU and RAM to handle the same amount of load (active users and bugs in the database). Another way of putting this is that the new implementation should be capable of serving a larger number of active users without requiring a hardware upgrade.
At first, I tried to test these assumptions by inspecting the timing, CPU usage and memory usage while manually browsing the btnetold and btnetnew instances. Unfortunately, it was difficult to see a substantial difference between the two implementations when only a single users was using the application. What I needed was a way to simulate a larger number of users interacting with BugTracker at the same time. There are a number of load testing tools available, including Test Studio by Telerik and Load Complete by SmartBear. If you have a Visual Studio Ultimate (or Enterprise) license, you can use the Visual Studio Load Tester like I did here.
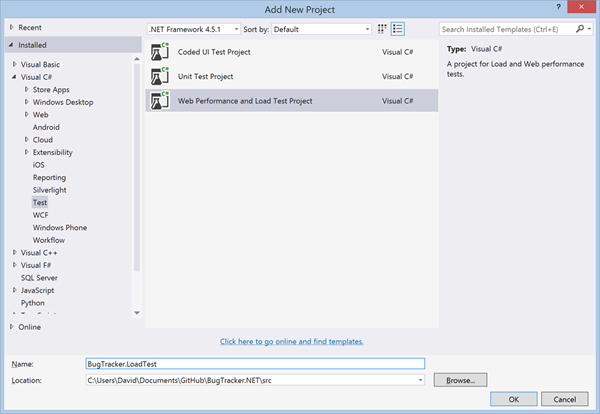
First, I added a new Web Performance and Load Test Project to the BugTracker solution.
New Web Performance and Load Test project
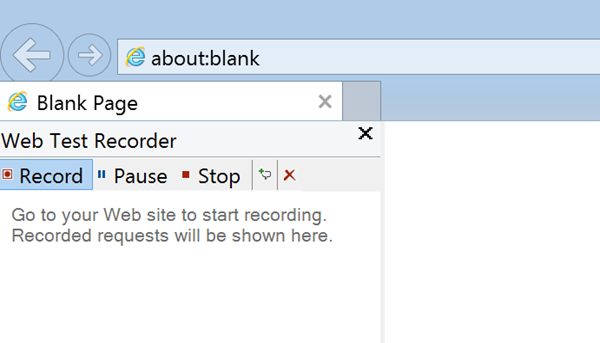
Next, we need to create some tests that simulate a user interacting with the two implementations. To do this, I added a new Web Performance Test to the test project. This opens Internet Explorer with the Web Test Recorder plugin started. In Internet Explorer, I can browse to a particular URL and perform the actions you want the use in your load test and the Web Test Recorder will record these actions.
Web Test Recorder
I performed the following actions on the btnetold instance:
- Login to BugTracker
- Click the Next Page link 5 times to test paging actions
- Click the Description column to test sorting
- Select a project from the projects column filter to test filtering
- Click the Next Page link 4 times to test paging with filtering and sorting applied
- Click the Previous Page link to test navigating to a previous page
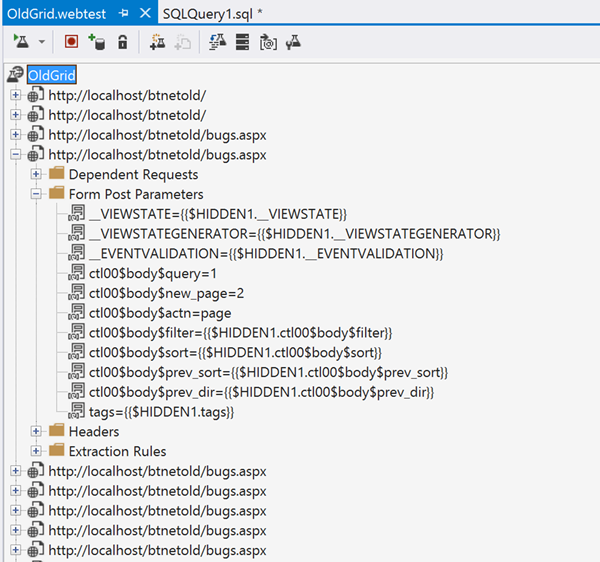
After completing these actions, I clicked the Stop button in the Web Test Recorder plugin. This takes me back to Visual Studio where I can review the actions that were recorded. The web test recorder keeps track of all the HTTP requests so they can be played back. You can run the test once by clicking the Run Test button. After reviewing the actions and ensuring that they appear to be correct, I saved this test as OldGrid.webtest. The requests consist mostly of post requests to the bugs.aspx page. Each post request has different form post values corresponding to the different actions I performed in Visual Studio.
Web Test to test original grid
If the changes we were testing had been limited to backend processing chances, we could simply add a parameter to the Web Test and run it against both the btnetold and btnetnew instances. Unfortunately, this won't work in our case because the changes involved drastic changes to the web requests themselves. The post requests to bugs.aspx won't work with the new implementation. Instead, we need to create a new web test specifically for the new version. I repeated the process above for the btnetnew instance. The resulting web test file is very similar but contains get requests to the api/BugQuery endpoint instead of the post requests to bugs.aspx.
The next step is to create a load test that can execute the individual tests we created to simulate a larger number of simultaneous users. To do this, I added a new Load Test to the test project. This opens the Load Test wizard which will guide you through the design of a load test. There are a number of options here that allow you to simulate very different scenarios. In particular, I was interested in seeing how the system would react to an increasing number of users performing the set of recorded grid actions at regular interval.
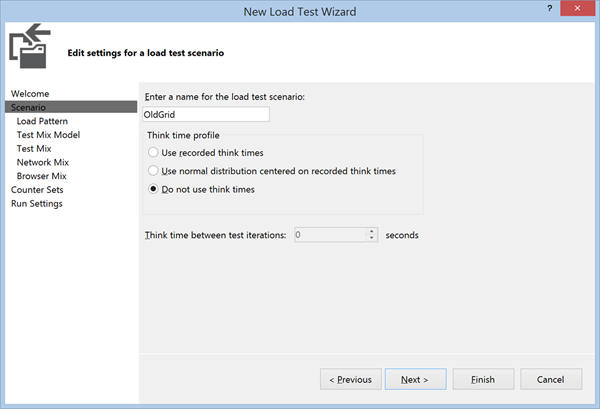
I called this load test scenario Old Grid and selected the Do not use think times. Think time refers to the amount of time that was taken between each of the steps recorded in the web test. By selecting Do not use think times, the load test runner will run the next step immediately after the current step is completed. I did not want to use think times because the recorded times are likely different between the old grid and new grid tests that I created. If the load test were to play the actions back with different timings, then we wouldn't be making a fair comparison.
Load Test Wizard - Think Times
In the next step, we are given options of how to simulate the load pattern. I chose to start with 10 users and increase the number of users by 10 every 10 seconds until we reach 200 users. This should allow us to see how BugTracker's CPU usage, memory usage and response time change as the number of users increases.
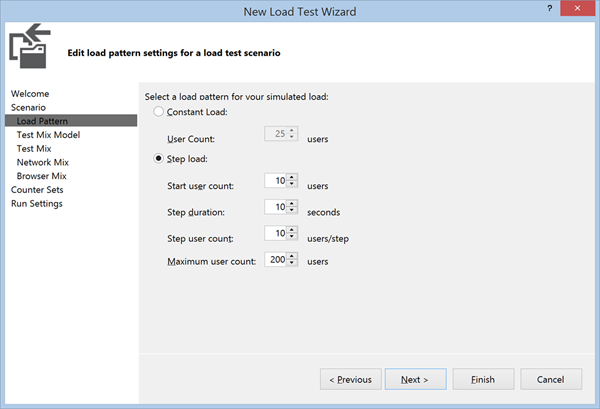
Load Test Wizard - Load Pattern Settings
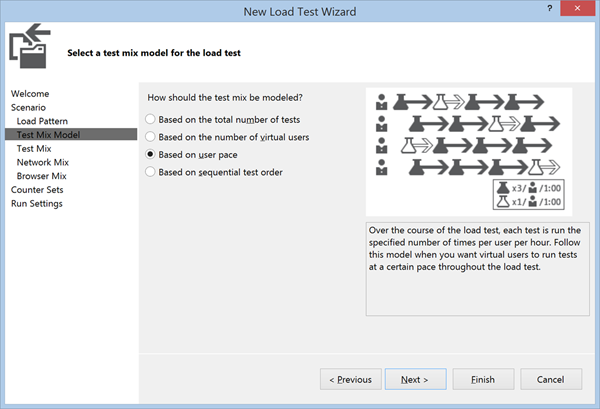
The next step in defining our load test is to select a test mix pattern. The test mix pattern defines how the load test runner will decide the frequency of each test per simulated user. Most of the options will simply repeat the tests in sequence as many times as possible in the given amount of time. These options are good for testing overall throughput of a server but are not as good at comparing the resource requirements of 2 different implementations. I chose the Based on User Pace option, which will allow us to specify how often each simulated user should execute a specific test.
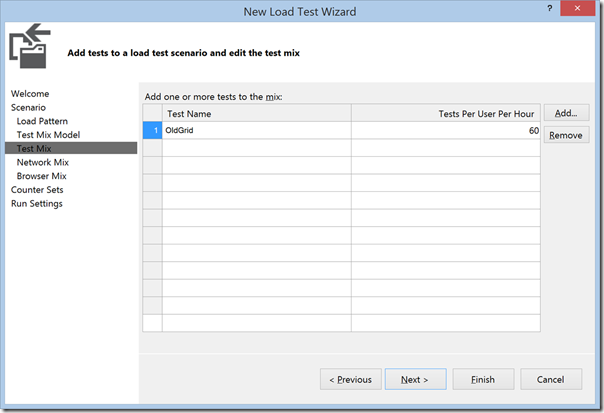
In the Test List, I added the Old Grid test and selected a pace of 60 times per hour, which is just a confusing way of saying each user should execute this test once every minute.
The Network Mix step allows you to simulate different network situations. I chose LAN because I am not particularly interested in seeing how the server behaves when clients are connected on slower connections. Likewise, the Browser Mix step allows you to select from a variety of different browsers. I chose Internet Explorer 11 because we are not interested in testing different browsers here.
Finally, in the Run Settings step, I chose a warm-up time of 30 seconds and a run time of 5 minutes. The 30 second warm-up time helps to remove any noise related to application startup time which is not what we are trying to test here.
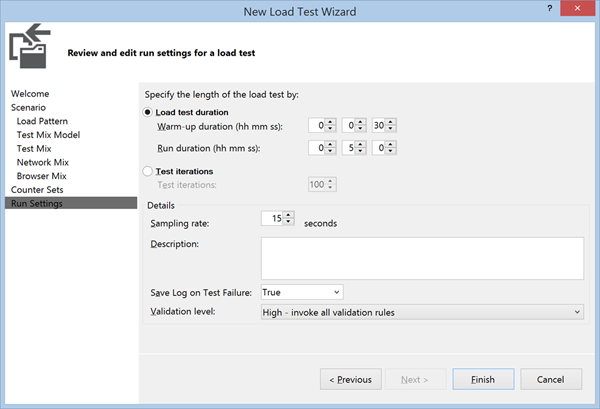
Load Test Wizard - Run Settings
I saved this as OldGridPace.loadtest and added a new Load Test for the NewGrid scenario, saving that test as NewGridPace.loadtest. With the tests created we can finally move ahead to finally running the tests.
Running the Tests
When I first tried running these tests, I was getting very inconsistent results. After doing some investigation, I noticed that other processes on my machine were using large amounts of my CPU and affecting the results. After disabling the Windows Search Indexer local service, turning off Windows Defender (anti-malware service) and pausing OneDrive syncing, I was able to get much more consistent results.
I repeated the tests for both instances 4 times with 100 bugs, 1,000 bugs, 10,000 bugs and 100,000 bugs to see how the performance characteristics would change as the number of bugs in the database increased. For each of the test runs, I would start the btnetold application pool, stop the btnetnew application pool and run the OldGridPace load test. Once that test completed, I would stop the btnetold application pool, start the btnetnew application pool and run the NewGridPace load test.
View the commit - Load Tests
Analyzing the Results
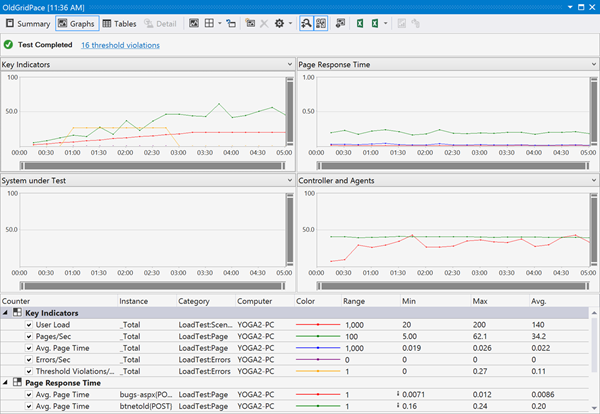
The load test runner in Visual Studio gives some nice looking graphs and summary information for each test run.
Load Test Graph Summary
There is more information that we really need here. We are specifically interested in comparing the CPU usage, memory usage and request response time for grid actions for each run. Another important number to look at is the total number of of tests run. Given the options we selected, we should expect each load test to execute somewhere around 670 tests. This number will vary a little because some of the individual tests will be in-process when the 5 minute load test ends. Those in process tests will not be included in the number of tests. If the total number of tests starts to fall, this is an indication that BugTracker is not able to keep up with the simulated load of the load test.
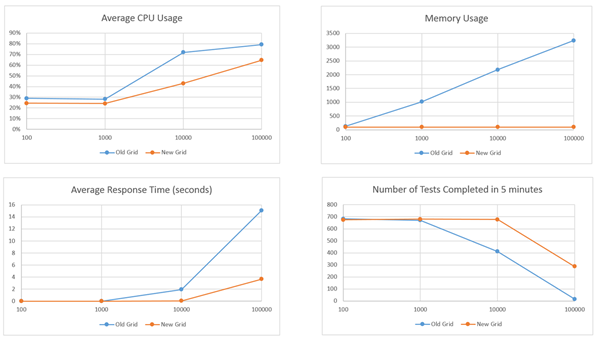
Here is a summary of the results for the overall load test:
Overall load test results
These results show that the new grid performs much better than the old grid in terms of response time, CPU usage and memory usage. The difference are more dramatic as the number of bugs in the database increases. This is largely due to the fact that the old grid stores the results of every bug query in session state. You can tell from the memory usage chart that the memory footprint of Bug Tracker with the old grid is a function of the number of active users and the number of bugs in the database. This is a stark contrast with the memory footprint of Bug Tracker with the new grid, which is a constant 100MB regardless of the number of active users or bugs in the database. What this means for the old grid is that both memory and CPU become a limiting factor in terms of how many active users the application can handle. We can see this by looking at the detailed results over the 5 minutes test run with 10,000 bugs.
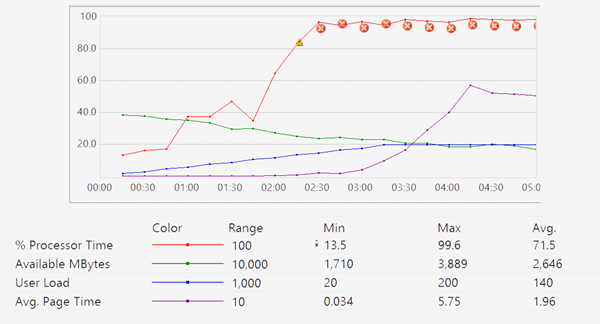
Old Grid with 10,000 Bugs
We can see that as the number of active users increases, the amount of available memory on the machine decreases due to the bugs being stored in session state. Eventually, the web server is using nearly 100% of the CPU retrieving and manipulating the data that is stored in memory. As a result, the average page request time starts to go up and the users start to see a significant delay when performing grid actions. On average, a grid action takes just under 2 seconds to process. During the 5 minute test, only 470 of the expect 670 tests are completed.
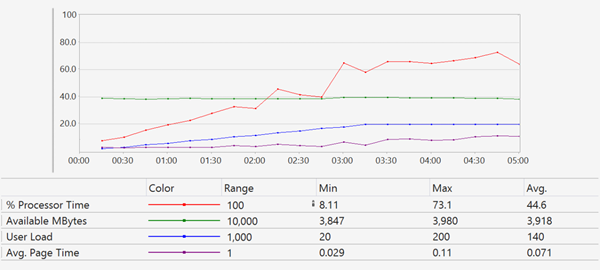
By comparison, the new grid performs well with 10,000 bugs in the database. The CPU usage does increase as the number of users increase, but the utilization never reaches a critical level. Memory usages is constant. Overall, the users likely do not notice a difference as grid actions are processed on average in 71ms. As a general rule of thumb, users will perceive any action that takes les than 100ms as instantaneous. Over the 5 minute test, all 670 tests are completed.
New Grid with 10,000 Bugs
When testing with 100,000 bugs, the old grid is only able to complete 17 tests. The web server process is immediately using 100% of the CPU and all available memory is used. The average response time to process grid actions is over 15 seconds. In this scenario, the new grid also starts to reach a limit. Memory usage is constant, but CPU usages eventually starts to approach 100%. A total of 271 tests are completed with the average response time to process grid actions of 3.7 seconds. It is interesting to compare the CPU usage between the old grid and the new grid in the 100,000 bug scenario. With the old grid, the Web Server was using 100% of the CPU. In the new grid, the Web Server was using 50% while SQL Server was using the other 50%. This means that for the new grid, we could potentially increase throughput by moving the database server to a different machine. With the old grid, our only option is to get a faster server.
