The Kudu Debug Console, Azure Websites best kept secret
Guest blog post from Azure MVP Guy Barrette
One of the advantages of using Azure Websites (now Web Apps in the Azure App Service) is that it’s a Platform-as-a-Service, meaning that you don’t have to maintain and patch the operating system but as a side effect, you can’t use remote desktop to connect directly to the machine even if you use the Standard service tier where you have your own VM. So what if you want to have a little more control over your Websites? The solution is to use the best kept Azure Websites secret: the Kudu debug console.
Kudu is the engine behind git deployments, WebJobs, and various other features in Azure Web Sites. Kudu is open source and you can find the source code at GitHub. In this article, I’ll focus on Kudu’s debug console.
https://github.com/projectkudu/kudu/wiki
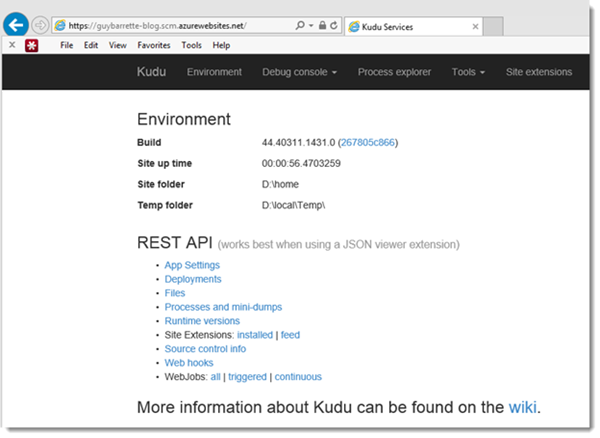
So what do you need to install and configure to access this super secret debug console? Nothing, it’s already there waiting for you. Simply insert SCM in the URL of your Website between the Website name and the azurewebsites.net domain like this:
TheWebSiteName.SCM.azurewebsites.net
If you’re not already authenticated, you’ll have to enter your Azure credentials to access the console.
Clicking on the Environment link at the top of the screen will take you to a page listing useful information when debugging:
- System Info
- App Settings
- Connection Strings
- Environment variables
- PATH
- HTTP Headers
- Server variables
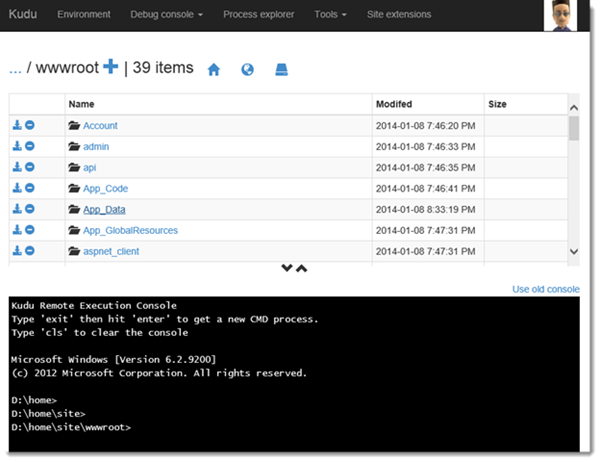
The Debug Console link gives you the option to open a command line or a PowerShell console.
You can use the UI and/or use the console to navigate the file system and the UI gives you icons to edit, delete or download a file.
So let’s say that you’re visiting friends and you receive that 3AM call asking you to fix something and you don’t have your laptop but have access to a browser. Well, you can do some basic fixes and changes right from the Kudu Debug Console. Using Internet Explorer, it’s even possible to upload files to your site by dragging & dropping them directly to the console. Now remember that you’re editing the live site here so be careful and don’t forget to change the source in the repository later. I know, best practices say “don’t do this!” but at 3AM, with a site down, you may be happy to have direct access to your site just by using a browser :-).
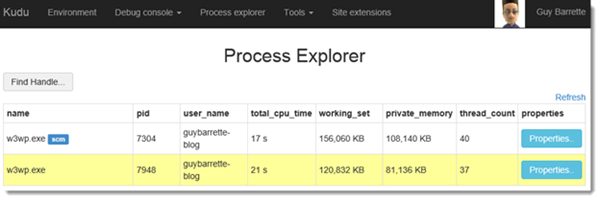
The Process Explorer link will take you to a page listing the processes currently running.
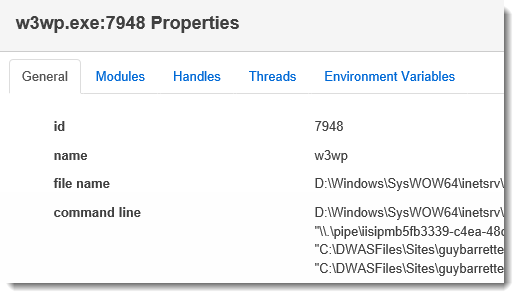
Clicking the Properties link will pop a window listing tons of information about the process.
And useful action buttons.
Notice that there are two W3wp.exe processes running: the main site and the SCM (Kudu) site but WebJobs would also appear here. So let’s say that there’s a bug in your WebJob and it is stuck, you can kill the process without restarting the whole site.
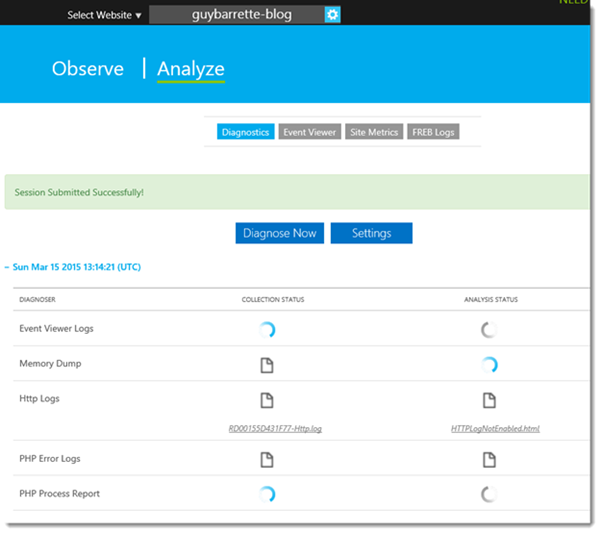
If you turned on diagnostic logging, the Tools menu gives you the option to download the logs and using the Support link, you have a nice UI giving you links to download the log files individually.
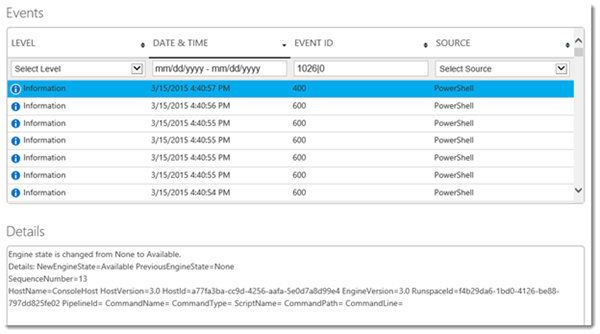
You also have access to the event logs and filter them by level, date, ID and source.
Now who said that having no RDP access to your WebSites virtual machine is a limitation? ;-)
