Ronin Building Blocks – Logging
Working with large scale distributed systems can be a challenge for the operations team whether it is handling capacity demands, scaling for cost, applying updates, rolling out new versions or keeping it safe and secure. Over the last two decades I have seen an ever-increasing demand for availability and uptime with an cyber attacks and other related threats on the rise. How do you support this? The answer is instrumentation, visibility and forethought!
Significant planning and collaboration is required to instrument and surface the data for your operations team. A representative from the operations team should be part of the design discussions, or at least brought in at key points to discuss what they believe they need to support it. I find it amazing that this is something I see again and again, like the operations and development teams are part of a dysfunctional family. Sometimes the operations team has not even reviewed the solution until training day they are thrown into supporting it and it is too late for change. Could you imagine buying a car and when you pick it up you notice you have a tachometer but no speedometer. Now you are driving down the street having to gauge your speed by the RPM, engine noise and feel?
Too much instrumentation can reduce performance and cause poor user experiences or drive the cost of goods too high to be viable; too little instrumentation results in the inability to debug and diagnose issues when they arise. I have heard this called psychic debugging due to the lack of numbers and facts to base it on. Trust me, this is not what I want to be doing!
The first piece of instrumentation I always add is logging. Logging is your best friend in a distributed system, but obviously is not everything as there will be many other pieces of data you will need to debug a solution. I have found that logging frameworks feel like they are changed in a solution every year for reasons I hear like it is “better performance”, “more extensible” or “easiest to use”. I have seen this time and time again so it brings one word to mind as an architect… ABSTRACTION!
Microsoft has recently released a logging framework that exposes a common set of interfaces while allowing other frameworks to be plugged in below the waterline. This means to change the logging framework, instead of having to modify my entire code base I can just change my code in a single location. For years now I have leveraged the concept of the ILogger interface to handle this having to then implement my own wrappers over the framework of the day. Seeing Microsoft’s framework already has the simple factories for the most common frameworks (e.g. NLog, Serilog, Loggr, Log4Net, etc.) I get that for free. The Microsoft framework is a NUGET package that works on .NET Core called Microsoft.Extensions.Logging.
I am going to walk through the most interesting usage aspects for the solution I am working on, building up from the most basic in case you have not used this framework before.
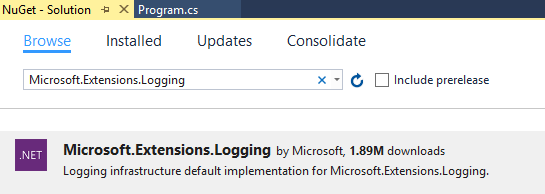
The typical way to start learning a framework is to do the “Hello World” sample, so why not just go with that. For this we will build out the plumbing with an implementation that will not have any logging sinks added, resulting in no messages being written. This is ok for the sample seeing we can wire those up easily after. The first thing I have to do is add the Microsoft.Extensions.Logging NUGET package to the solution.
Using the framework always starts with the instantiation of the logger factory. This factory is the heart of the framework being used to manage the various logging providers. By default there are no logging providers added to it but it will function without exceptions being thrown as you see here.
   using Microsoft.Extensions.Logging;

  class Program
  {
    static void Main(string[] args)
    {
      using (ILoggerFactory factory = new LoggerFactory())
      {
        ILogger logger = factory.CreateLogger<Program>();

        logger.LogInformation("Hello world!");
      }
    }
  }
As you can see above I create a logger using the CreateLogger<T> method which will use the name of the generic type provided as the category name. I find that more times than not this is the category name I want to use. I use the log level specific methods as a rule of thumb when writing out the messages verses the more generic Log method. The log levels can be used to turn up and down the verbosity for one or all providers as I will demonstrate later. Here is the log level enumeration that the framework provides.
   public enum LogLevel
  {
    Trace,
    Debug,
    Information,
    Warning,
    Error,
    Critical,
    None,
  }
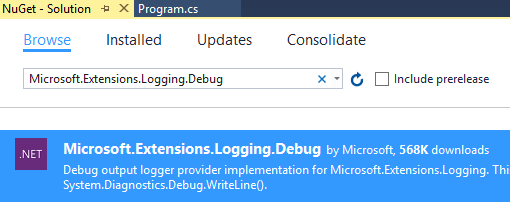
Adding the debug stream as a logging sink is easy, I first add the NUGET package for the provider (Microsoft.Extensions.Logging.Debug) as seen here.
Most of the providers you want to add will have NUGET packages that are prefixed with Microsoft.Extensions.Logging. Once this is installed I also log a message at warning level to demonstrate how you the provider shows each level slightly differently. Here is the updated code.
using Microsoft.Extensions.Logging;
class Program
{
static void Main(string[] args)
{
using (ILoggerFactory factory = new LoggerFactory())
{
factory.AddDebug();
ILogger logger = factory.CreateLogger<Program>();
logger.LogInformation("Hello world!");
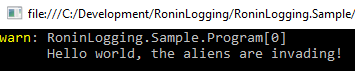
logger.LogWarning("Hello world, the aliens are invading!");
}
}
}
And the output from the code that is displayed in the debug stream is as follows.
RoninLogging.Sample.Program: Information: Hello world!
RoninLogging.Sample.Program: Warning: Hello world, the aliens are invading!
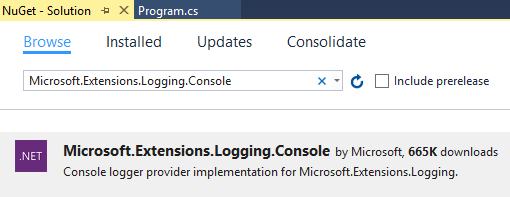
This is great, we now have a fully functioning logger that writes to the debug stream. I am also going to have it write to the console sink. To add the console sink I add it’s NUGET package.
Using the add console extension method that the provider offers I attach it to the factory. This means that the logging framework will write each message to both the debug and the console provider.
factory.AddConsole();
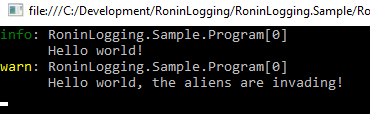
When I run the program now I see the same output as before being written to the debug stream and the following being output to the console.
The important thing to note here is that not all the providers will have a nice and easy to use extension method like AddConsole or AddDebug, but it is common. If the provider does not expose this, you can create an instance of the provider and add it using the AddProvider method. You might even want to create your own provider to tie in with your operation team’s specialized logger, this can be done through the creation of your own customer provider.
Looking at this now it is possible that the whole world does not want the informational message, just the warning so I would like to hide the informational from the console, but still have it show up in the debug channel. I can do this simply by using a filter when the console provider is added.
factory.AddConsole((text, logLevel) => logLevel >= LogLevel.Warning);
When I run this, I can see that the debug stream has the same output as before but the console only has the warning.
Using this framework in a demo application is simple enough, but what happens when I am using it in a larger system, what should I do? I like to share a factory with any instances that require the same providers and have each of those instances create their own instance of the logger to try and reduce mitigate between them.
When I am working in larger systems there are quite a few times that I want to write log messages in a scope (call chain etc.). Think of the scenario where I am logging within a class but want to easily the way it arrived at a point in my code, such as a method to display an error message. I can accomplish this through the creation of logging scopes that will continue until the scope is disposed of as seen below. I made a couple changes to highlight the scope use that included removing the console filter I had added previously and telling the console provider to include the scope printout.
   using Microsoft.Extensions.Logging;

  class Program
  {
    static void Main(string[] args)
    {
      using (ILoggerFactory factory = new LoggerFactory())
      {
        factory.AddDebug();
        factory.AddConsole(true);

        ILogger logger = factory.CreateLogger<Program>();
        logger.LogInformation("Hello world!");

        using (logger.BeginScope("Planetary Surveillance System"))
        {
          logger.LogWarning("Hello world, the aliens are invading!");
        }

        logger.LogInformation("Goodbye world!");
      }
    }
  }
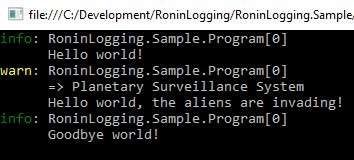
So now when we look at the output we see the scope included above the scoped message and absent on the others.
Just for demonstration purposes let’s see what happens when we use the logger from something that is not in the scope (e.g. asynchronous tasks running that should not have their call stack modified) seeing that was one of my original concerns. I am modifying the code to have an asynchronous method called WriteAnotherMessageAsync that will be called before it enters the scope (index 1), but not write until in the scope and then call it within the scope again (index 2).
   using Microsoft.Extensions.Logging;

  class Program
  {
    private static readonly SemaphoreSlim _control = new SemaphoreSlim(1);

    static void Main(string[] args)
    {
      using (ILoggerFactory factory = new LoggerFactory())
      {
        factory.AddDebug();
        factory.AddConsole(true);

        ILogger logger = factory.CreateLogger<Program>();
        _control.Wait();
        var writeTask = WriteAnotherMessageAsync(logger, 1);
        logger.LogInformation("Hello world!");

        using (logger.BeginScope("Planetary Surveillance System"))
        {
          logger.LogWarning("Hello world, the aliens are invading!");
          _control.Release();
          writeTask.Wait();
          WriteAnotherMessageAsync(logger, 2).Wait();
          logger.LogWarning("Hello world, the aliens are invading again!");
          _control.Wait();
        }

        logger.LogInformation("Goodbye world!");
        _control.Release();
      }
    }
     private static async Task WriteAnotherMessageAsync(ILogger logger, int index)
    {
      await _control.WaitAsync().ConfigureAwait(false);

      try
      {
        logger.LogInformation($"Another message { index }");
      }
      finally
      {
        _control.Release();
      }
    }
  }
You notice it honors the behavior we would expect as you see here! This means that scopes are very usable for us.
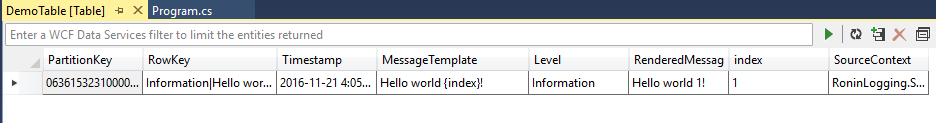
Now that I have demonstrated all the basic semantics and boiler plate aspects of the logging framework you should be jumping out of your chair saying, “but this is just writing strings, we are to be doing better than that”. I will use the Serilog provider to write to Azure Table Storage with each of the properties passed into the logged message being broken out into individual properties as seen here.
   using Microsoft.Extensions.Logging;
  using Serilog;

  class Program
  {
    static void Main(string[] args)
    {
      var account = CloudStorageAccount.DevelopmentStorageAccount;

      Log.Logger = new LoggerConfiguration().WriteTo.AzureTableStorageWithProperties(account, storageTableName:"DemoTable").CreateLogger();

      using (ILoggerFactory factory = new LoggerFactory())
      {
        factory.AddSerilog();
        var logger = factory.CreateLogger<Program>();

        logger.LogInformation("Hello world {index}!", 1);
      }
    }
  }
Using this technique a table named DemoTable is created in my local storage emulator with an entity that has a broken out timestamp and index making it easier and typically faster to consume the logs when needed.
Serilog offers a lot more sinks than Azure Table Storage so now that we know the capabilities I will choose the proper sink at a later point. This is the beauty of loose coupling after all!