Understanding Application Domains
When talking to long time .NET developers about application domains (AppDomains) they often understand the high level concepts but not necessarily how or why they would use them. My goal of this article is to help clarify some of the scenarios where AppDomains offer value and describe how to go about using them. In order to provide this information to readers of various levels of knowledge and interest I will flag certain areas as “In Memory”. By reading these sections they will provide you a greater understanding of what is happening behind the scenes for those of us that love detail but you will still understand the what, why and how if you skip these.
So what is an AppDomain? Simply put an AppDomain is a unit of isolation in the .NET CLI used to control the scope of execution and resource ownership.
When we look at threads it is important to understand that several threads can belong to a single AppDomain. This however does not mean that a thread is confined to that one AppDomain, rather it can only execute within a single AppDomain at any given time.
So why is this important? Suppose your “full trust” application needs to use an assembly that was dynamically generated, received from a less credible source or simply put has a significant level of risk associated with its execution? Would you not prefer to run it with a reduced set of “permissions”? Through the use of AppDomains you have the ability to do just that, execute the majority of your code in full trust while isolating the questionable assembly to another partially trusted AppDomain. In fact you can select from a set of well-known permissions or customize them as appropriate. Sometimes you will hear this approach referred to as sandboxing.
From another vantage point you will note that .NET draws a large number of framework elements and assemblies into the executing code as well as holding static and rooted objects until the AppDomain is unloaded. By executing these assemblies that consume large amounts of memory in another AppDomain you can release the memory when you are done with them by unloading the specific AppDomain without impacting the rest of your application. Obviously if you have objects in memory that you are holding with security sensitive contents the ability to clean them up sooner is often a great advantage.
What if my application has a requirement for a high degree of auditing? AppDomains expose some additional events that provide the ability to log the occurrence of or react to First Chance and Second Chance exceptions.
In short, I tend to look at introducing secondary AppDomains into my application when security, auditing or memory consumption concerns exist.
So this is great right? Why wouldn’t I always use AppDomains, in fact why does the .NET framework not automatically put the AppDomain structure around all of my calls to external resources? Well like all good things there is a down side. Simply put the creation and unloading of an AppDomain has a performance cost and is not something you want to do constantly. To control the performance impact it is often better to create the AppDomain, run the iterations of your code in that AppDomain and when appropriate unload the AppDomain.
Anyone that has knowledge of Win32 development or operating system principals may be saying “wait a minute, isn’t the process the unit resource ownership? Well this is correct from an operating system point of view, but the operating system has no knowledge of the Common Language Runtime (CLR), in fact it is just another COM server to it. When the CLR is initialized it will create the Default AppDomain (named the same as the entry point assembly) used to hold all of the resources and scope code execution to that unless the code explicitly makes use of secondary AppDomains.
Considerations when making use of AppDomains for security are:
Set the application base to an appropriate directory, typically not the same as the host AppDomain. The AppDomain’s application base is the directory that will be used as the root when resolving assembly references. Due to this use there may be scenarios where permissions are implied based on its location (ex. Internet, intranet etc.)
You have the ability to pass in a list of strong named assemblies that can be loaded by the AppDomain as full trust. Consider using this list verses putting them in the GAC. Placing an assembly in the GAC allows all AppDomains to execute it as “Full Trust”.
Grant the minimum permissions possible that still allow the assembly to execute.
If there is a set of standard permissions that match your requirements of your executing assembly leverage them instead of defining your own (ex. SecurityManager.GetStandardSandbox).
Variations in Type resolution can be setup in different AppDomains by implementing the TypeResolve event handler. This event is fired when the CLR cannot determine the assembly that contains the specified Type. Using this event handler you can return the Assembly from the location of your choice.
Considerations when making use of AppDomains for Memory Usage:
Multiple AppDomains in the same process that leverage the same DLLs (assemblies) will map to the same code space in the processes memory. This often eases the concern of some developers about base image footprints.
If the assembly being loaded into the AppDomain contains many or large static objects or properties it may inflate the size of your process when you create it and or impact performance. The reason for this ties back to the fact that static elements are associated with the AppDomain not the process and multiple AppDomains with the same assembly will hold multiple static versions of static objects.
Considerations when making use of AppDomains for Auditing:
There are times when an application will terminate unexpectedly as a result of an unhandled exception. This type of exception is known as an Unhandled Exception and can occur due to code defects and environmental changes. In building an application that must strictly audit all system events and activities it may be desirable to log what has happened to cause the termination. Through the implementation of the UnhandledException event handler you are notified prior to the application terminating in this situation. In the event handler you can audit and or take corrective action such as storing state or firing out additional diagnostics structures.
Implementation of the ProcessExit event handler will provide the consumer with up to two seconds to take the appropriate actions including state persistence and logging when the process is requested to shut down.
Now that we understand the why and when of AppDomains let’s look at them in a little more detail. In my first example we will assume that I have decided to leverage an existing DLL that one of my colleagues built for another system. I have been made painfully aware that it has a built in caching algorithm which seems to consume a lot of memory. In my particular scenario I need to call a single method in the library many times in a row over the period of 15 minutes to support my batch processing. After the batch processing is complete I do not need it again until the next evening. So let’s look at a simulation of this scenario.
The library that I am using is comprised of two classes:
The cached object holds the state of the transaction etc. The payload size of the state information is large for demonstration reasons but in a typical scenario would be smaller with higher object volumes.
namespace DemoLibrary
{
using System;
internal sealed class MyCachedObject
{
private static Random generator = new Random();
private byte[] processedData;
public MyCachedObject()
{
processedData = newbyte[generator.Next(25, 70) * 1024];
}
public int Execute(int id)
{
return processedData.Length;
}
}
}
There is a central class called the Processor that manages the cached objects, holding existing instances to maximize reuse and reduce both start-up and processing time. This is a simple cache handled by the id of the object. In the output message it will return the application domain name.
namespace DemoLibrary
{
using System;
using System.Collections.Generic;
public class Processor
{
private static readonly Dictionary<int, MyCachedObject> myCache = new Dictionary<int, MyCachedObject>();
public string ProcessRequest(int id)
{
if (!myCache.ContainsKey(id))
{
myCache.Add(id, newMyCachedObject());
}
int cacheSize = myCache[id].Execute(id);
return string.Format("This is a response message from id {0} with a cache size of {1} in the AppDomain named: {2}", id, cacheSize, AppDomain.CurrentDomain.FriendlyName);
}
}
}
For future examples the library above will not change, only the console application. When referring to the library it implies the two classes outlined above.
To simulate the application that is consuming the memory I will use a console application that waits after the processing is complete so I can inspect the memory.
namespace AppDomainDemo
{
using System;
using System.Diagnostics;
using DemoLibrary;
class Program
{
staticvoid Main(string[] args)
{
ProcessRequestBatch();
// Only added to force a collection for demonstration purposes, please do not do this in production
// inducing a GC is typically not good a good practice
GC.Collect();
Console.WriteLine("Completed the batch press enter to continue");
Console.ReadLine();
}
private static void ProcessRequestBatch()
{
Stopwatch watch = new Stopwatch();
Processor demoProcessor = new Processor();
watch.Start();
for (int index = 0; index < 10000; index++)
{
int id = index % 5000;
Console.WriteLine(demoProcessor.ProcessRequest(id));
}
watch.Stop();
Console.WriteLine("The processing took {0} ms to complete.", watch.ElapsedMilliseconds);
}
}
}
Now that we have setup the simulation and the code has been explained we will look at the results and memory footprint to understand what is happening behind the scenes.
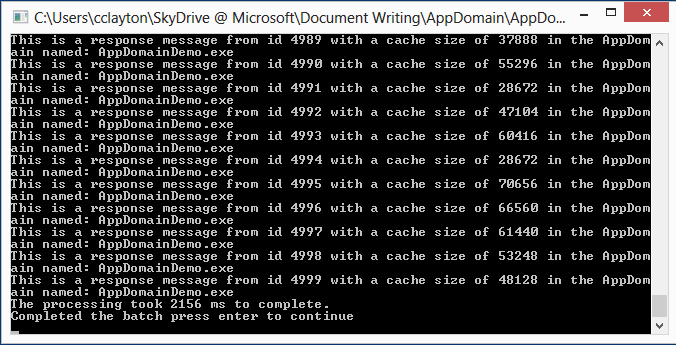
Reviewing the console output we can see that the job took 2156ms to complete all of the iterations. Also note that all of the responses came from the AppDomainDemo.exe, this is the default AppDomain associated with my application which is named AppDomainDemo.exe. Typically this is referred to as the default AppDomain.
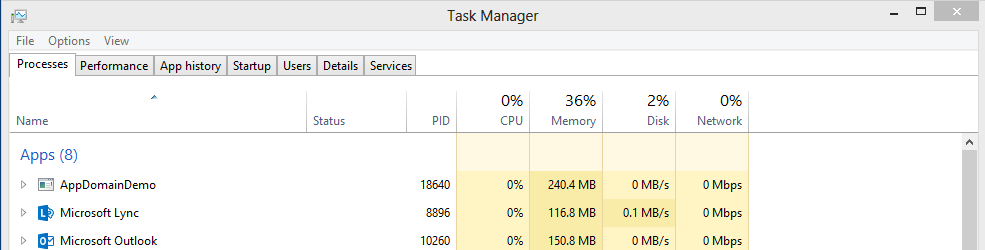
By reviewing the Task Manager we can see that the process has increased in memory consumption and is holding onto 240.4MB of memory. A significant portion of this memory consumption can be attributed to the cached objects (we only know this because we know the code at this point) even though the instance of the Processor has dropped out of scope.
So why is it holding this memory, the library dropped out of scope did it not? We are not using it anymore, are we? In order to answer this we will turn to WinDBG (https://msdn.microsoft.com/en-us/windows/hardware/gg463009.aspx). The contents of the WinDBG logs have been shorted and you will notice ‘…’ in places where I have removed unnecessary information.
In Memory
Review the statistics of the heap so we can understand what objects are consuming space:
0:003> !DumpHeap -stat
Statistics:
MT Count TotalSize Class Name
000007ff491113d8 1 24 System.Int64
...
000007ff490ff0a8 11 50748 System.Int32[]
000007feea935070 5000 120000 DemoLibrary.MyCachedObject
000007ff490ff108 7088 170112 System.Int32
000007ff490e0630 3569 234560 System.Object[]
000007feea936168 2 299280 System.Collections.Generic.Dictionary`2+Entry[[System.Int32, mscorlib],[DemoLibrary.MyCachedObject, DemoLibrary]][]
000007ff490fd5e0 3551 866340 System.Char[]
000007ff490fc358 14348 1326108 System.String
00000010a61ab330 5059 3818824 Free
000007ff491004d0 5003 241150729 System.Byte[]
Total 43727 objects
Now that we noticed our object DemoLibrary.MyCachedObject is consuming a lot of space (120MB) with a count of 5000 instances we can look at why this is. We will dump out the heap entries for these objects and see each individual object’s address.
0:003> !DumpHeap -type DemoLibrary.MyCachedObject
Address MT Size
00000010a83c3130 000007feea935110 80
...
00000010b6d68958 000007feea935070 24
00000010b6d77c70 000007feea935070 24
00000010b6d84f88 000007feea935070 24
00000010b83c9638 000007feea936168 97200
00000010b83e11e8 000007feea936168 202080
Statistics:
MT Count TotalSize Class Name
000007feea935110 1 80 System.Collections.Generic.Dictionary`2[[System.Int32, mscorlib],[DemoLibrary.MyCachedObject, DemoLibrary]]
000007feea935070 5000 120000 DemoLibrary.MyCachedObject
000007feea936168 2 299280 System.Collections.Generic.Dictionary`2+Entry[[System.Int32, mscorlib],[DemoLibrary.MyCachedObject, DemoLibrary]][]
Total 5003 objects
We can now select one of these addresses and look at what AppDomain they are associated with.
0:003> !FindAppDomain 0x00000010b83e11e8
AppDomain: 00000010a61c2700
Name: AppDomainDemo.exe
ID: 1
Now that we know that our objects are directly associated with the AppDomain named AppDomainDemo.exe (Id 1) let’s see what other AppDomains are in the current process.
0:003> !DumpDomain
--------------------------------------
Domain 1: 00000010a61c2700
LowFrequencyHeap: 00000010a61c2eb8
HighFrequencyHeap: 00000010a61c2f40
StubHeap: 00000010a61c2fc8
Stage: OPEN
SecurityDescriptor: 00000010a61c4850
Name: AppDomainDemo.exe
Assembly: 00000010a61af170 [C:\Windows\Microsoft.Net\assembly\GAC_64\mscorlib\v4.0_4.0.0.0__b77a5c561934e089\mscorlib.dll]
…
What we can see from this is that there is only one AppDomain at the moment (beyond the shared) and will now inspect the object to see where its roots are.
0:003> !GCRoot 0x00000010b83e11e8
HandleTable:
00000010a61717d8 (pinned handle)
-> 00000010b83c5658 System.Object[]
-> 00000010a83c3130 System.Collections.Generic.Dictionary`2[[System.Int32, mscorlib],[DemoLibrary.MyCachedObject, DemoLibrary]]
-> 00000010b83e11e8 System.Collections.Generic.Dictionary`2+Entry[[System.Int32, mscorlib],[DemoLibrary.MyCachedObject, DemoLibrary]][]
Found 1 unique roots (run '!GCRoot -all' to see all roots).
From this we can see that the object is rooted by a static dictionary object. This maps to our understanding of the source code. For a final check we will review the modules and see that DemoLibrary and AppDomainDemo are both still loaded even though it is no longer being used by our code.
0:003> lm
start end module name
00000010`a5cc0000 00000010`a5cc6000 AppDomainDemo (deferred)
00000010`a63f0000 00000010`a63f6000 DemoLibrary (deferred)
000007ff`47bc0000 000007ff`47cee000 clrjit (deferred)
...
000007ff`56b80000 000007ff`56d3e000 ntdll (private pdb symbols) c:\windbg\privatesymbols\ntdll.pdb\FFC2810A1E6F4EC49B4E4A0257637EC62\ntdll.pdb
Unloaded modules:
000007ff`56420000 000007ff`565d0000 combase.dll
Back to the Basics
So what can we do to change this behavior? When I am done my batch and want to continue running in my application I do not need these objects around for the next 24 hours? Well to free up this memory we can use AppDomains. Here is the same application modified slightly, without changing the library that will free the memory when we are done with it. We will create an AppDomain using the same security evidence as the default AppDomain, execute our code in that domain and then unload it.
Here is one way we can adjust the console application to solve this problem, without a need to change the library:
namespace AppDomainDemo
{
using System;
using System.Diagnostics;
using DemoLibrary;
class Program
{
staticvoid Main(string[] args)
{
ProcessRequestBatch();
// Only added to force a collection for demonstration purposes, please do not do this in production
// inducing a GC is typically not good a good practice
GC.Collect();
Console.WriteLine("Completed the batch press enter to continue");
Console.ReadLine();
}
private static void ProcessRequestBatch()
{
Stopwatch watch = new Stopwatch();
watch.Start();
AppDomain domain = AppDomain.CreateDomain("ProcessingDomain");
ProcessingWrapper demoProcessor = (ProcessingWrapper)domain.CreateInstanceAndUnwrap(Assembly.GetExecutingAssembly().FullName, typeof(ProcessingWrapper).FullName);
demoProcessor.ProcessRequestBatch();
AppDomain.Unload(domain);
watch.Stop();
Console.WriteLine("The processing took {0} ms to complete.", watch.ElapsedMilliseconds);
}
}
public sealed class ProcessingWrapper : MarshalByRefObject
{
publicvoid ProcessRequestBatch()
{
Processor demoProcessor = newProcessor();
for (int index = 0; index < 10000; index++)
{
int id = index % 5000;
Console.WriteLine(demoProcessor.ProcessRequest(id));
}
}
}
}
In order to make it so we can execute an assembly in a separate AppDomain we need to inherit from the MarshalByRefObject base class. I am attempting to make as few changes to the core library as possible so I have decided to move my loop into a separate class named ProcessingWrapper that inherits from it. The code within this MarhsalByRefObject is virtually identical to the code that as calling it before, without the instrumentation seeing it is more relevant in the default AppDomain.
In order to call the assembly in a separate AppDomain we must first create one with the appropriate permissions. I am not doing this for security reasons so I will use the same permissions and application root in the processing AppDomain as the default. In order to instantiate the type in the new AppDomain we call the CreateInstanceAndUnwrap, after which it is business as usual until I perform the final unload when my processing is done.
So now that we have seen the modifications how does that impact our application?

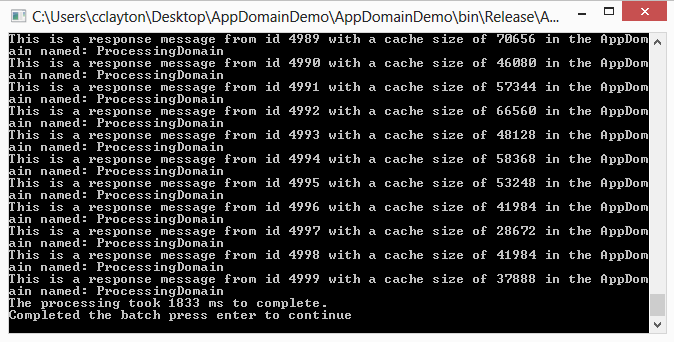
As you can see from the console this iteration took 2057ms and was executed from the ProcessingDomain AppDomain. If we were to have created an AppDomain with every call to the Processor we would have seen a significant performance impact here.
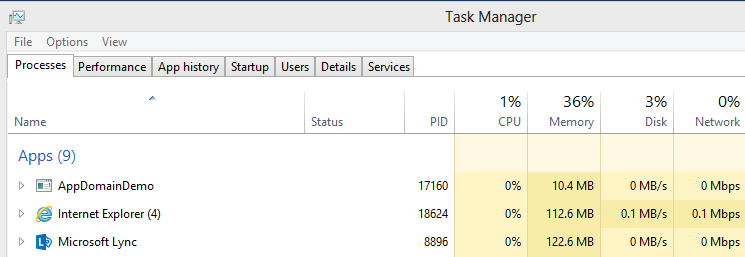
In the task manager we can see that the memory has dropped back down to 10.4 MB as the AppDomain was released. The memory may still be high after the AppDomain releases until the next garbage collection and this is why we introduced the GC.Collect().
Now that we have seen the memory gets released, what does it actually look like? I reran the application and attached a WinDBG to it partway through the run to get the best snapshot of memory mid processing and will then look at it after the run as we did before.
In Memory
0:007> !DumpHeap -stat
Statistics:
MT Count TotalSize Class Name
000007f900ad4be0 1 24 System.Threading.TimerHolder
…
000007f900abf108 3387 81288 System.Int32
000007f8a2864e20 5000 120000 DemoLibrary.MyCachedObject
000007f900aa0630 1765 159728 System.Object[]
000007f8a2865718 2 299280 System.Collections.Generic.Dictionary`2+Entry[[System.Int32, mscorlib],[DemoLibrary.MyCachedObject, DemoLibrary]][]
000007f900abd5e0 1709 412384 System.Char[]
000007f900abc358 7032 636788 System.String
0000002f5f40b0e0 5155 3792654 Free
000007f900ac04d0 5005 240021562 System.Byte[]
Total 29505 objects
When we look at the heap statistics output above we notice that our cached object is on the heap at this point just as before.
0:007> !DumpHeap -type DemoLibrary.MyCachedObject
Address MT Size
0000002f618a1e18 000007f8a2864ec0 80
…
0000002f7013c9b0 000007f8a2864e20 24
0000002f701454c0 000007f8a2864e20 24
0000002f7189f838 000007f8a2865718 97200
0000002f718b73e8 000007f8a2865718 202080
Statistics:
MT Count TotalSize Class Name
000007f8a2864ec0 1 80 System.Collections.Generic.Dictionary`2[[System.Int32, mscorlib],[DemoLibrary.MyCachedObject, DemoLibrary]]
000007f8a2864e20 5000 120000 DemoLibrary.MyCachedObject
000007f8a2865718 2 299280 System.Collections.Generic.Dictionary`2+Entry[[System.Int32, mscorlib],[DemoLibrary.MyCachedObject, DemoLibrary]][]
Total 5003 objects
We review a few more details about the instances of my cached object and find one we are interested in looking deeper at.
0:007> !FindAppDomain 0x0000002f701454c0
AppDomain: 0000002f5f470ae0
Name: ProcessingDomain
ID: 2
The object is rooted in ProcessingDomain AppDomain as we had intended.
0:007> !DumpDomain
--------------------------------------
Domain 1: 0000002f5f423520
LowFrequencyHeap: 0000002f5f423cd8
HighFrequencyHeap: 0000002f5f423d60
StubHeap: 0000002f5f423de8
Stage: OPEN
SecurityDescriptor: 0000002f5f4101a0
Name: AppDomainDemo.exe
Assembly: 0000002f5f4147c0 [C:\Windows\Microsoft.Net\assembly\GAC_64\mscorlib\v4.0_4.0.0.0__b77a5c561934e089\mscorlib.dll]
…
--------------------------------------
Domain 2: 0000002f5f470ae0
LowFrequencyHeap: 0000002f5f471298
HighFrequencyHeap: 0000002f5f471320
StubHeap: 0000002f5f4713a8
Stage: OPEN
SecurityDescriptor: 0000002f5f40f700
Name: ProcessingDomain
Assembly: 0000002f5f4147c0 [C:\Windows\Microsoft.Net\assembly\GAC_64\mscorlib\v4.0_4.0.0.0__b77a5c561934e089\mscorlib.dll]
…
Notice from the output above that there are two AppDomains now (excluding the shared which we will not discuss in this article), one is the Default AppDomain and the other is the Processing AppDomain we created in our code. The ProcessingDomain AppDomain is where we executed our library.
0:007> lm
start end module name
0000002f`5eee0000 0000002f`5eee6000 AppDomainDemo (deferred)
0000002f`5f6d0000 0000002f`5f6d6000 DemoLibrary (deferred)
000007f8`f95b0000 000007f8`f96de000 clrjit (deferred)
…
000007f9`0f8d0000 000007f9`0fa8e000 ntdll (private pdb symbols) c:\windbg\privatesymbols\ntdll.pdb\FFC2810A1E6F4EC49B4E4A0257637EC62\ntdll.pdb
Unloaded modules:
000007f9`0ec20000 000007f9`0edd0000 combase.dll
Finally reviewing the modules you will notice that at this point there is no change really other than the code was executed in another AppDomain, the library is still in memory and the process is still consuming the memory from caching.
So now let’s look at the memory after it has finished processing, unloaded the AppDomain and performed a garbage collection. Remember the AppDomains are still using the generational heaps and as such even though the AppDomain may be gone, until the Garbage Collector finds it has no more roots and cleans it up the memory is still being held.
0:006> !DumpHeap -stat
Statistics:
MT Count TotalSize Class Name
000007f900ad13d8 1 24 System.Int64
000007f900ac14b0 1 24 System.Collections.Generic.GenericEqualityComparer`1[[System.String, mscorlib]]
000007f900abc588 1 160 System.Exception
000007f900abb7b0 3 192 System.Reflection.MemberFilter
…
000007f900abc0f0 7 768 System.Collections.Hashtable+bucket[]
000007f900ac0f48 3 1608 System.Globalization.CultureData
000007f900abd5e0 9 4004 System.Char[]
000007f900abe648 95 5320 System.RuntimeType
000007f900abc358 237 11906 System.String
000007f900aa0630 41 37312 System.Object[]
Total 549 objects
The first point to note is that when we dump the heap statistics we do not see any of our cached objects. Just to be sure that we did not miss them we will dump all of the objects of the cached object type.
0:006> !DumpHeap -type DemoLibrary.MyCachedObject
Address MT Size
Statistics:
MT Count TotalSize Class Name
Total 0 objects
This confirms that none of our cached objects are on the heap.
0:006> !DumpDomain
--------------------------------------
Domain 1: 0000002f5f423520
LowFrequencyHeap: 0000002f5f423cd8
HighFrequencyHeap: 0000002f5f423d60
StubHeap: 0000002f5f423de8
Stage: OPEN
SecurityDescriptor: 0000002f5f4101a0
Name: AppDomainDemo.exe
At this point we no longer have the second AppDomain, it has been unloaded from memory and the related objects have been cleaned up by the garbage collector.
0:006> lm
start end module name
0000002f`5eee0000 0000002f`5eee6000 AppDomainDemo (deferred)
0000002f`5f6d0000 0000002f`5f6d6000 DemoLibrary (deferred)
000007f8`f95b0000 000007f8`f96de000 clrjit (deferred)
…
000007f9`0f8d0000 000007f9`0fa8e000 ntdll (private pdb symbols) c:\windbg\privatesymbols\ntdll.pdb\FFC2810A1E6F4EC49B4E4A0257637EC62\ntdll.pdb
Unloaded modules:
000007f9`0ec20000 000007f9`0edd0000 combase.dll
You may be saying right about now, wait, hold on, I would have thought that the DemoLibrary would be an unloaded module seeing the AppDomain is gone? What is going on? Well the way I built the code has the console application still with a reference to the DemoLibrary and any related static variables to the use of that library from the AppDomainDemo will still be rooted and therefore the module is not unloaded. This means that the data portion of memory associated with the ProcessingDomain AppDomains use is released though.
Back to the Basics
So let’s change things up here and consider the scenario where we want to make use of that same library but don’t fully trust it. Sometimes when we take assemblies from other sources they could modify registry or other core system settings etc. without us knowing if the assembly that is making use of them is full trust. To protect against that we will start with our previously modified console and use the AppDomain as a security sandbox instead.
The only piece that we need to change is the ProcessRequestBatch method where we create the AppDomain. We will run in the AppDomain first with all of the code explicitly set to run it in the “Trusted” zone, then with the change of a single line of code we will reduce the permissions. In fact when we reduce the permissions it will fail because it will try to load our console application assembly which it does not have rights to do, even though it is copied into the same application directory.
private static void ProcessRequestBatch()
{
conststring DirectoryName = @"C:\Test";
Stopwatch watch = newStopwatch();
watch.Start();
// Create the permission set found in the Trusted zone
Evidence domainEvidence = newEvidence();
domainEvidence.AddHostEvidence(newZone(SecurityZone.Trusted));
PermissionSet permissions = SecurityManager.GetStandardSandbox(domainEvidence);
// Create the directory to be used as the sandbox and copy the soon to be untrusted assembly to it
if (!Directory.Exists(DirectoryName)) Directory.CreateDirectory(DirectoryName);
string untrustedAssemblyPath = Assembly.GetAssembly(typeof(Processor)).Location;
File.Copy(untrustedAssemblyPath, Path.Combine(DirectoryName, Path.GetFileName(untrustedAssemblyPath)), true);
// Copy the one dependency assembly
string trustedAssembly = Assembly.GetExecutingAssembly().Location;
File.Copy(trustedAssembly, Path.Combine(DirectoryName, Path.GetFileName(trustedAssembly)), true);
// Create the AppDomain configuration object
AppDomainSetup domainSetup = newAppDomainSetup() { ApplicationBase = DirectoryName };
// Create the AppDomain with the full trust permissions in the sandbox defined
AppDomain domain = AppDomain.CreateDomain("ProcessingDomain", domainEvidence, domainSetup, permissions, null);
ProcessingWrapper demoProcessor = (ProcessingWrapper)domain.CreateInstanceAndUnwrap(Assembly.GetExecutingAssembly().FullName, typeof(ProcessingWrapper).FullName);
demoProcessor.ProcessRequestBatch();
AppDomain.Unload(domain);
watch.Stop();
Console.WriteLine("The processing took {0} ms to complete.", watch.ElapsedMilliseconds);
}
The first thing we do above is setup the evidence that will be used to tell the CLR what permissions we want to grant the assembly. In this case we are giving the assembly “Trusted” so it will be able to launch our console application and other assemblies. As mentioned previously for consistency I have leveraged the SecurityManager’s default permission set for the “Trusted” zone rather than creating my own.
The sandbox directory is created and the required assemblies are copied to it. Remember the application base should be changed for security reasons and it becomes the root for type resolution within the AppDomain.
The final steps are to create the AppDomain setup information object and pass the information into the AppDomain.Create function call. You will notice the final parameter is a null, this parameter can be used to pass a list of strong named assemblies that the AppDomain allows code executing in it to invoke.
As we can see by the console output everything has run successfully in the “Trusted zone. So what happens when we change the security zone to untrusted? Will everything still run ok? Let’s try it.
private static void ProcessRequestBatch()
{
const string DirectoryName = @"C:\Test";
Stopwatch watch = new Stopwatch();
watch.Start();
// Create the permission set found in the untrusted zone
Evidence domainEvidence = new Evidence();
domainEvidence.AddHostEvidence(newZone(SecurityZone.Untrusted));
PermissionSet permissions = SecurityManager.GetStandardSandbox(domainEvidence);
// Create the directory to be used as the sandbox and copy the untrusted assembly to it
if (!Directory.Exists(DirectoryName)) Directory.CreateDirectory(DirectoryName);
string untrustedAssemblyPath = Assembly.GetAssembly(typeof(Processor)).Location;
File.Copy(untrustedAssemblyPath, Path.Combine(DirectoryName, Path.GetFileName(untrustedAssemblyPath)), true);
// Copy the one trusted assembly that we will allow "full trust"
string trustedAssembly = Assembly.GetExecutingAssembly().Location;
File.Copy(trustedAssembly, Path.Combine(DirectoryName, Path.GetFileName(trustedAssembly)), true);
// Create the AppDomain configuration object
AppDomainSetup domainSetup = newAppDomainSetup() { ApplicationBase = DirectoryName };
// Create the AppDomain with the untrusted permissions in the sandbox defined
AppDomain domain = AppDomain.CreateDomain("ProcessingDomain", domainEvidence, domainSetup, permissions, null);
ProcessingWrapper demoProcessor = (ProcessingWrapper)domain.CreateInstanceAndUnwrap(Assembly.GetExecutingAssembly().FullName, typeof(ProcessingWrapper).FullName);
demoProcessor.ProcessRequestBatch();
AppDomain.Unload(domain);
watch.Stop();
Console.WriteLine("The processing took {0} ms to complete.", watch.ElapsedMilliseconds);
}
You will notice that the only piece of code that changed is highlighted in yellow. Now let’s see what happens when we run this.
You will notice at the top of the console it was a permission’s check that failed. So this is a simple example of how to setup permissions in a secondary AppDomain. So what next? Well the last thing to cover is how the AppDomain can help you in auditing.
In order to demonstrate logging of exceptions I have made a change to the library used to this point. Rather than executing any logic when ProcessRequest is called it immediately raises an ApplicationException. This has been done for demonstration purposes.
namespace DemoLibrary
{
using System;
using System.Collections.Generic;
public class Processor
{
private static readonly Dictionary<int, MyCachedObject> myCache = newDictionary<int, MyCachedObject>();
publicstring ProcessRequest(int id)
{
thrownewApplicationException("Oops an error occurred.");
}
}
}
In order to log the exceptions when they occur within the application domain we have added four event handlers, two to the ProcessingDomain and two to the Default AppDomains.
private static void ProcessRequestBatch()
{
Stopwatch watch = newStopwatch();
watch.Start();
AppDomain domain = AppDomain.CreateDomain("ProcessingDomain");
domain.FirstChanceException += (sender, args) => Console.WriteLine("First chance exception happened and the processing domain recorded it.");
domain.UnhandledException += (sender, args) => Console.WriteLine("Unhandled exception happened and the processing domain recorded it.");
AppDomain.CurrentDomain.FirstChanceException += (sender, args) => Console.WriteLine("First chance exception happened and the default domain recorded it.");
AppDomain.CurrentDomain.UnhandledException += (sender, args) => Console.WriteLine("Unhandled exception happened and the default domain recorded it.");
ProcessingWrapper demoProcessor = (ProcessingWrapper)domain.CreateInstanceAndUnwrap(Assembly.GetExecutingAssembly().FullName, typeof(ProcessingWrapper).FullName);
demoProcessor.ProcessRequestBatch();
AppDomain.Unload(domain);
watch.Stop();
Console.WriteLine("The processing took {0} ms to complete.", watch.ElapsedMilliseconds);
}
It is very important that we view these as “event handlers” and not “exception handlers”, the exceptions that are raised will continue to bubble up whether it is first or second chance. We have two types of exceptions to be notified of being first chance and unhandled. Every exception that is raised starts as a first chance and if no exception handlers catch them are elevated to a second chance or unhandled exception. Unhandled exceptions will cause the process to terminate.
It can be very interesting to use for auditing, especially the unhandled (second chance) exceptions as they are terminal. First chance exceptions need to be audited with caution as they are raised even if the exception is handled. In the scenario that an application or library uses exception handling as for flow of control this can quickly drive the application to its knees.
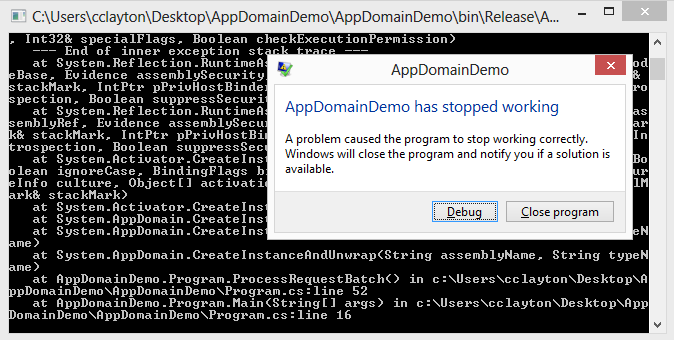
So let’s run the code above and see the output.
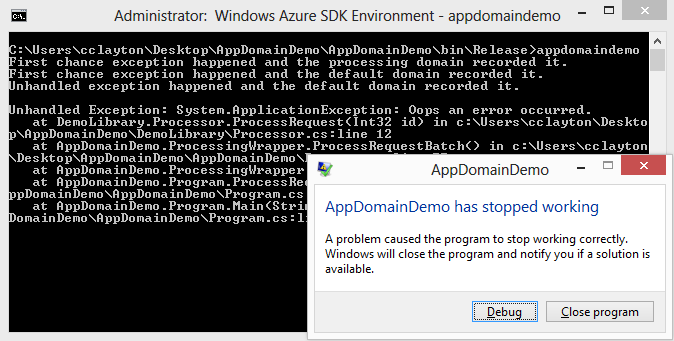
If you notice in the console output above we see that the first chance exception is raised in the ProcessingDomain AppDomain first then when not handled there it bubbles up to the Default AppDomain. Finally note that the unhandled (second chance) exception is generated from the Default AppDomain. Unhandled exceptions will not be raised in the secondary AppDomains as the last AppDomain to have an opportunity to handle an exception is the Default AppDomain.
I hope this has assisted you in your understanding of Application Domains, what they are as well as how and why to use them.