Basic Analysis of a Managed Memory Dump (.NET)
When looking for the root cause of a crash collecting the memory dump is only the first step. This posting assumes that you already have a properly configured version of WinDBG along with a memory dump of a managed process.
In order to highlight the differences between managed and unmanaged debugging I will continue with the same scenario I used in my unmanaged posting. The following is the scenario we will assume.
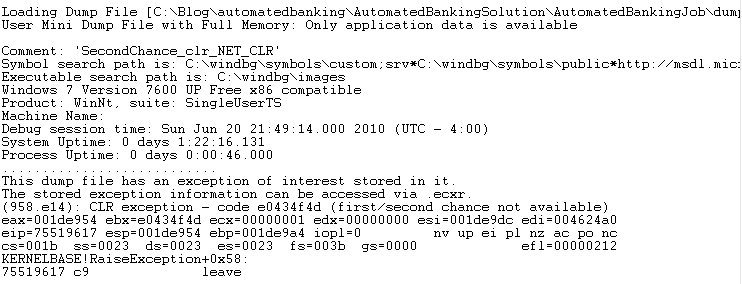
You are a software vendor that has written an automated banking machine application. Several times a day the kiosk is restarted by the customer because the application has crashed. In an effort to identify the cause of the crash, which happens when you are not there, you have used ADPLUS to collect a User Mode memory dump. The memory dump has been copied onto your machine and you are ready to start debugging.
To begin debugging open the second chance exception dump by selecting “File -> Open Crash Dump…” and select the dump file to be analyzed.
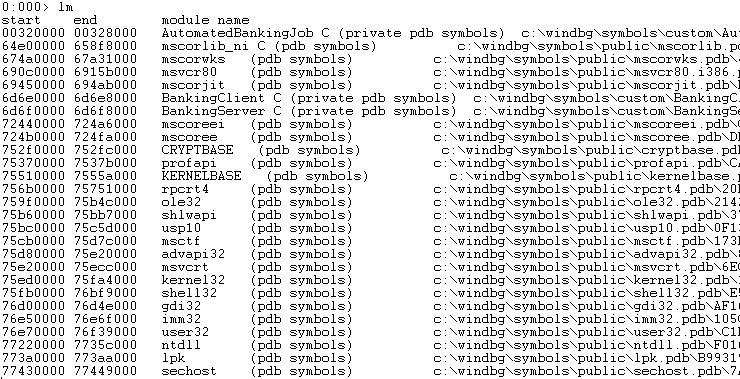
In an effort to remove some of the delays that can be incurred from downloading symbols during a debugging session I like to force a reload at the beginning using the “.reload /f” command. After running this command execute “lm” to list the modules and their associated symbols to ensure they found the proper PDB’s.
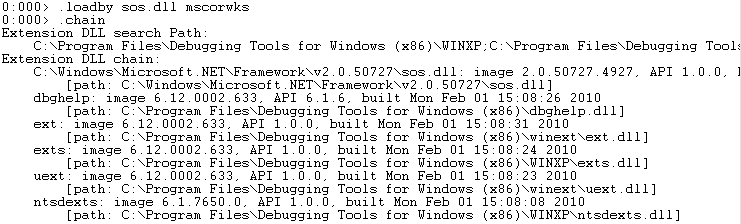
It is important to understand that WinDBG was originally made without any understanding of managed code. Debugging of managed code is made possible through the use of extension DLL’s. The extension we will focus on for the remainder of this article is called “Son of Strike” (SOS) packaged as SOS.dll. This extension is included with each framework version and can be found in the “C:\Windows\Microsoft.NET\Framework\{version}” directory, where {version} is the .NET framework version. The SOS version must match the version of the framework in the dump file. The easiest way to load the appropriate version is to have WinDBG do the work for us based on the mscorwks.dll version in the dump file. To load the SOS.dll extension we execute “.loadby sos.dll mscorwks”. If it loads correctly no error message will be returned and we can verify it is correct by executing the “.chain” command. The SOS.dll will be seen in the output of the “.chain” command.
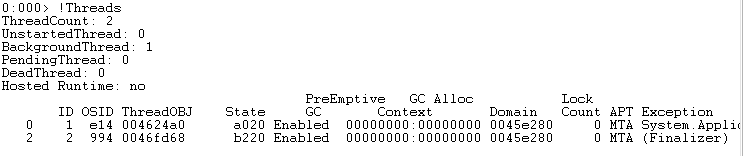
To see all of the managed threads in a dump we execute the “!threads” command. A managed thread is not the same as an unmanaged thread so only the threads that are executing managed code are returned. It should be noted that you will see a “finalizer” thread in the output. The "finalizer" thread is used to execute the registered terminators in any managed assemblies within the process. For the purpose of this posting we will not dig any deeper into it. The first column is the unmanaged thread id and the second column is the managed id. In our example the thread of interest is unmanaged thread id 0 and managed thread id 1. The last column identifies the last exception which occurred on the thread. You can see below that there was an exception of type “ApplicationException” with an address of 0x01997bb8 that occured on managed thread 1.
If you are required to change the current thread context to the first managed thread using its native thread id. Execute the command “~0s”.
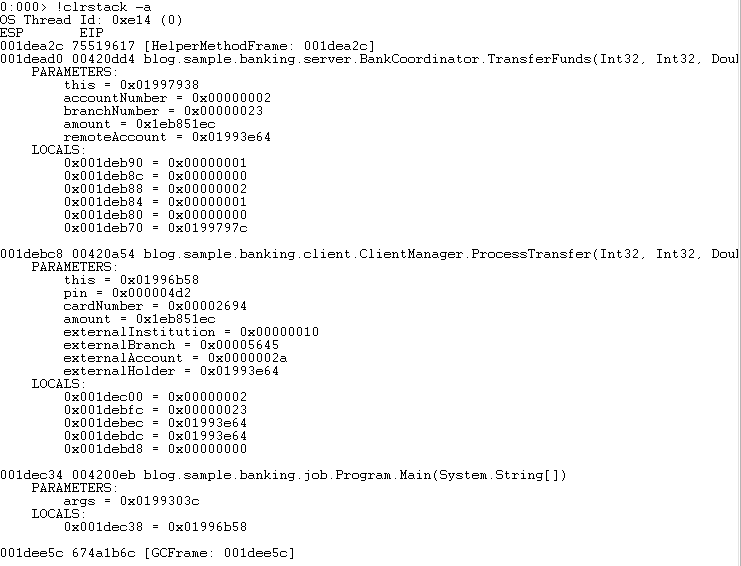
To review the call stack that generated the exception execute the “!clrstack –a” command. This command displays the method names along with the parameters and local variables, assuming private symbols are available. When reading the output the most recent method call is at the top of the list.
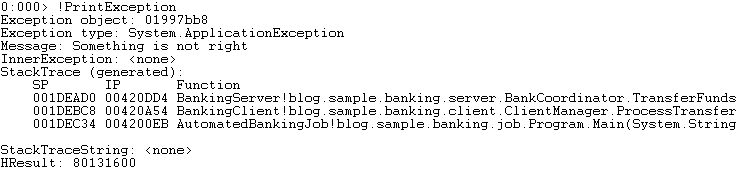
In order to find out what error was thrown we execute the “!PrintException” command to display the details of the error which occurred. We can see that the exception is an “ApplicationException” with the message text of “Something is not right”.
When reviewing the source code it can be seen that there is more than one code path that could cause this same error message. In an effort to determine root cause we need to review the parameter values passed to the top most method (TransferFunds). Based on the parameters returned from "!clrstack -a" we only have one parameter that needs deeper inspection. The string is a reference object which means we execute the “!do 0x01993e64” command. The "!do" command dumps the contents of an object (reference type). The parameter passed to this command is the address of the string we see in the parameter list.
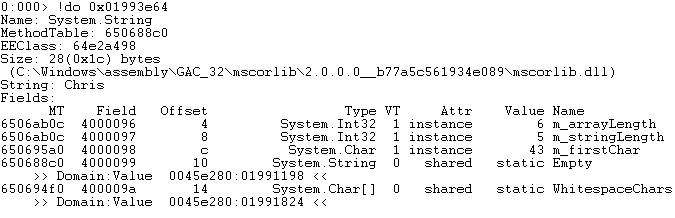
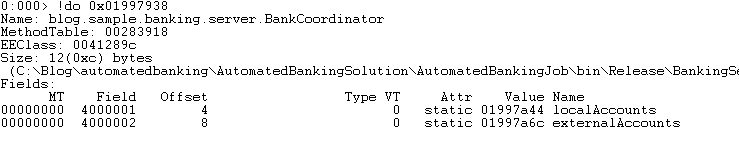
Reviewing the output of the command it can be seen that the value is “Chris” based on the line "String: Chris". With the value of the parameters now in place we review the source code and find that there are two loops that if either fails will generate this same error message. In the event that you do not possess the source code you can use SOS to save the module to the hard drive and review it with a source code reflector. The loops compare the parameter values to the contents of class scoped collection variables. Using the address of the “this” pointer passed into the method as a parameter (based on calling conventions) we dump the object to find the address of the two collections.
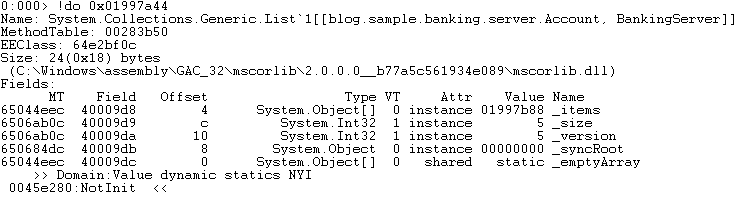
Dumping the localAccounts variable will show the internal structure of the generic list. Reviewing the output we see that there are 5 elements in the collection.
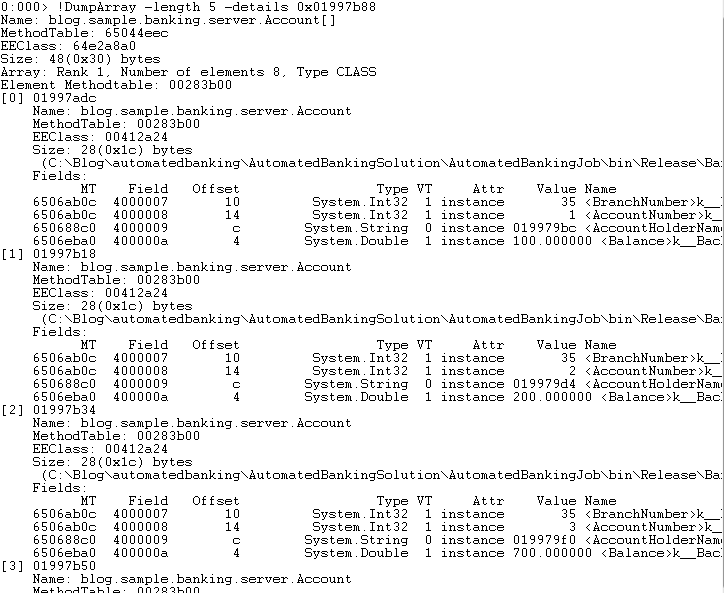
To review the elements in the array we leverage the “!DumpArray -length 5 -details 0x01997b88” command. Comparing the output to the source code logic we can see that the account was found in the localAccounts collection and will not throw the exception in question.
Performing the same examination of the externalAccounts collection it can be seen that the financial institution does not exist and will cause the identified exception.