Internet Explorer 9 Developer Tools Deep Dive – Part 4: Profiling JavaScript
This continues a series of posts on the F12 Developer Tools included with Internet Explorer (since version 8) to help you improve your websites with tools to review content, diagnose issues, improve performance, and more:
- Part 1 – Introduction
- Part 2 – Working with HTML and CSS
- Part 3 – Debugging JavaScript
- Part 4 – Profiling JavaScript
- Part 5 – Network Performance and Debugging
If this is your first look at the F12 Tools, I recommend you skim through the introductory post first.
Profiling JavaScript with Internet Explorer
In the last post, we saw many ways to help create JavaScript that is correct, but what about making it efficient? Though the new “Chakra” JavaScript engine in IE9 helps, it certainly that doesn’t mean we can stop looking for ways to optimize script performance.
Let’s fire up the IE9 Developer Tools (press F12 or choose Tools –> F12 Developer Tools) and take a look.
Introduction to Profiling
The F12 Tools’ Profiler tab lets you analyze the execution of JavaScript, showing which functions (whether custom or built-in) are being called and where time is spent.
Just click “Start profiling”, load a page and/or use page functionality, and click “Stop profiling”. You can also use F5 and Shift+F5 to start/stop, though I rarely find that easer.
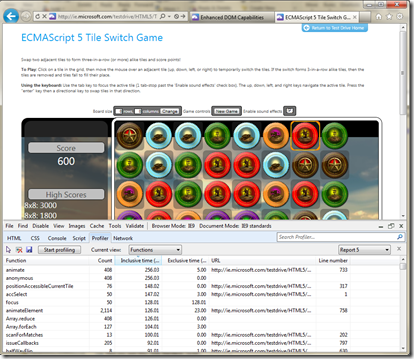
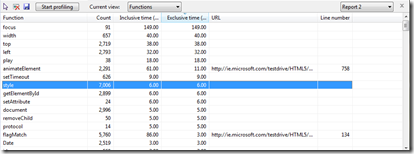
In this example, we’re using the “ECMAScript5 Tile Switch Game” sample from the IETestDrive site
When the session is stopped a report of the instrumented script is shown, including the following by default:
- Function name
- Count of times called
- Inclusive time (ms) – Time in the function plus any functions it calls
- Exclusive time (ms) – Time in the function only
- URL (of file containing the function)
- Line number
Viewing Function Source Code
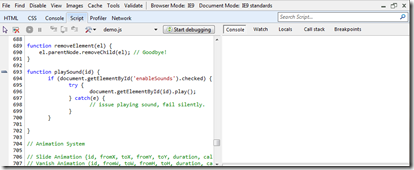
Double-click a line to go directly to the source for the function, if you have access to it. See Part 3 - JavaScript debugging for more on the Script tab.
Tip: Typically you can click to source where the URL field is specified. In this case playSound(), but not play() or getElementById():
Tip: You can also add the Function type column (see next) and look for “User” functions.
Click the Profiler tab to return to the list.
Customizing and Sorting the Report
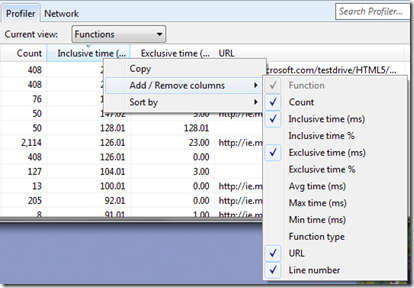
There are more details available via columns that are hidden by default. To show them, right-click in the report and choose “Add / Remove columns”:
This will give access to:
- Inclusive time % – Percent of total time
- Exclusive time %
- Avg time (ms)
- Max time (ms)
- Min time (ms)
- Function type – User, DOM, Built-In
The right-click menu also enables sorting by displayed columns, but you’ll probably find it easier to click on column headers to toggle between sorting ascending and descending.
Report Views
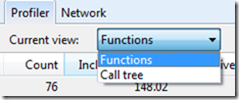
There are two options available for viewing profiling report data: Functions and Call Tree views.
Functions View
By default, reports are shown in Functions view, listing content at the function level (one line per function) and allow an easy way to see where the most calls are made and where time is spent.
Call Tree View
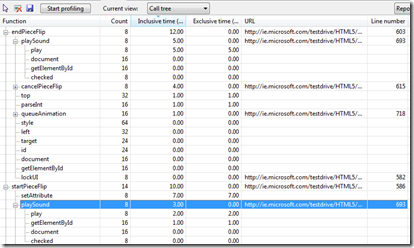
Call Tree view shows the same data (each line is still a specific function), organized into a hierarchy by caller/callee relationships. From the root function(s), expand to see functions were called (and continue to expand to functions they in turn called.)
- Tip: Unlike in Functions view, the same function may appear in more than one place because it was called by different parts of the application. In the above picture, playSound() appears under endPieceFlip() and startPieceFlip().
Sorting in Call Tree view works at the group level, with each subgroup sorting individually.
Searching Reports
As with other areas of the F12 Tools, use the Search box to find functions by name:
If a match is found, use the Next/Previous Result buttons  (Enter / Shift+Enter) to navigate results.
Comparing Reports
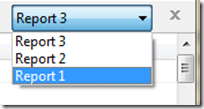
As you create profiling sessions, you may notice the report drop-down is keeping track:
Use this to switch between individual profiling sessions. These are retained only for the life of the window.
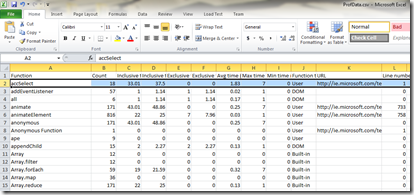
To save the data for later use, or to perform more analysis, click the “Export data” button  to save to a CSV format (that can then be load directly into Excel):
- Tip: You can copy items (tab-delimited format) from the report directly. Click, CTRL+Click (for multiple items), or CTRL+A (all items), then CTRL+C or right-click and choose “Copy” to add details to the clipboard.
Once in Excel, you can decide where to go next. Build up an archive to document application performance during development, create various analysis graphs, or even extend Excel with .NET to help detect changes and trends from session to session.
Performance Optimization Tips
Now that you know how the profiler works, what should you be looking for? It’s a huge topic, subject of books, presentations, and articles, but here are some ideas to get you thinking:
- Find hotspots – Obvious, but hard to master. Invest time where there’s the largest potential benefit. Profile, then sort on exclusive time to get a quick view. The more you read JavaScript optimization articles & books and keep up with advances in JavaScript (e.g. new ECMAScript 5 options), the better you’ll be at finding ways to improve.
- High function counts – Having many calls to a function isn’t necessarily a problem, but it’s a good place to start looking. Can you refactor to batch requests together? Move conditionals earlier to prevent code path execution (a good use of the Call Tree view)? Make asynchronous requests?
- Repeated calls – Calling a function with the same arguments repeatedly? Recomputing values frequently? They may be a good candidates for caching and/or precomputing common requests (server- or client-side).
- Use realistic data – Some issues only manifest themselves in production scenarios. Test with realistic data and conditions… before your users do (e.g. testing that document processor using “Hello world!” might not be enough.)
Again, just a starting point, and many books and articles await you. For more ideas, watch Jason Weber’s “50 Performance Tricks to Make Your HTML5 Web Sites Faster” session from Mix11.
Next: Part 5 – Network Performance and Debugging
JavaScript execution is only part of the performance landscape. How you utilize (and don’t utilize) the network is another major performance factor.
In the next article, we’ll take a look at the Network feature that was added to the F12 Tools with Internet Explorer 9.
-Chris

