Heap Corruption: A Case Study
Here we go again: it is snowing in Milan while I am publishing a new blog post . Admittedly, this coincidence is getting more and more interesting, maybe meteorogists can spot a pattern here
.
Today's topic is a tough one: memory corruption.
Introduction
Memory corruption, in general, is one of the toughest issues to work with. For several reasons:
- It is not immediate, for starting, to understand that a problem (endless loop, unexpected behavior, crash) is caused by a memory corruption.
- Historically, user-mode processes with their own virtual address space and the separation of user-mode and kernel mode were meant to provide an isolated environment for code, so that bad code which, for example, could cause a memory corruption, was not able to adversely affect other code. On the other hand, the appearance of "host processes" like svchost.exe for services, dllhost.exe for COM+ applications and w3wp.exe for ASP.NET and Web Services, made again different components run in the same process. There are benefits to it, but the fact that different software shares a common address space means that, when a memory corruption occurs, the whole process is affected. Moreover, it may be difficult to determine which component is at fault.
- The consequences of a memory corruption typically manifest themselves at a later time, when the corrupted area is read. At that time it is difficult, if not impossible, to backtrack to the source of the corruption.
In case you wonder, the additional isolation provided by .NET through AppDomains does not help in this case: if memory gets corrupted in an address space there is no way to recover.
Memory, memory, memory: is it really all alike?
Well no, it is not. The virtual address space can in turn be divided into:
- Plain virtual memory, accessed directly through VirtualAlloc() and VirtualFree()
- Stacks: each thread in a process is given a user-mode stack in the process' virtual address space. It's size can be determined through the /STACK linker option.
- Code: this piece of memory contains code which is loaded from an executable module (dll or exe), including static/global variables
- Heaps: a process starts life with an initial heap (called the process heap), whose size is determined by the /HEAP linker option. At runtime, any number of heaps can be created/destroyed with the HeapCreate()/HeapDestroy() functions. Within heaps, memory can be allocated/deallocated through HeapAlloc()/HeapFree()
- Thread-Local Storage (TLS)
- Managed heap: this is the memory used by the CLR to allocate objects and to provide its memory services like for example the Garbage Collector
It is important to understand a couple of things:
- The high-level memory structures described above (Stacks, Code, Heaps, Managed Heap) are all layered on top of plain virtual memory. In other words, the system uses VirtualAlloc()/VirtualFree, or logical equivalents, to allocate memory for stacks, heaps and managed heaps. For example, the Heap Manager calls VirtualAlloc() to get a chunk of virtual memory (a Heap Segment). The Heap Manager then divides the segment into smaller, variable-size areas (Heap Blocks).
- The managed heap is layered on top of plain virtual memory, not on top of operating system heaps. In other words, a "managed heap" is not an OS heap.
Inspecting memory with the debugger
So what happens if you would like to know to which area of memory a given address belongs? The !address debugger extension is your friend here. Let's see this in practise.
Let's attach the debugger to a running instance of notepad.exe (BTW: I am not sure how useful is notepad for other purposes , but I definitely recommend it as a debugging target: easy to launch, no problem if you stop it in the debugger, no problem if you terminate it while debugging) and let's familiarize ourselves with the !address command:
 0:000> kb
ChildEBP RetAddr  Args to Child
0011fe10 768bf837 768bf86a 0011fe54 00000000 ntdll!KiFastSystemCallRet
0011fe14 768bf86a 0011fe54 00000000 00000000 USER32!NtUserGetMessage+0xc
0011fe30 002f1418 0011fe54 00000000 00000000 USER32!GetMessageW+0x33
0011fe70 002f195d 002f0000 00000000 0051213a notepad!WinMain+0xec
0011ff00 77a74911 7ffdc000 0011ff4c 778ee4b6 notepad!_initterm_e+0x1a1
0011ff0c 778ee4b6 7ffdc000 4b9dc4d5 00000000 kernel32!BaseThreadInitThunk+0xe
0011ff4c 778ee489 002f31ed 7ffdc000 00000000 ntdll!__RtlUserThreadStart+0x23
0011ff64 00000000 002f31ed 7ffdc000 00000000 ntdll!_RtlUserThreadStart+0x1b
 0:000>  !address 0011fe30
 ProcessParametrs 00511400 in range 00510000 0054b000
 Environment 005107e8 in range 00510000 0054b000
    000e0000 : 0010f000 - 00011000
                    Type     00020000 MEM_PRIVATE
                    Protect  00000004 PAGE_READWRITE
                    State    00001000 MEM_COMMIT
                    Usage    RegionUsageStack
                    Pid.Tid  17c.1de
 00:000>  !address 0051213a
 ProcessParametrs 00511400 in range 00510000 0054b000
 Environment 005107e8 in range 00510000 0054b000
    00510000 : 00510000 - 0003b000
                    Type     00020000 MEM_PRIVATE
                    Protect  00000004 PAGE_READWRITE
                    State    00001000 MEM_COMMIT
                    Usage    RegionUsageHeap
                    Handle   00510000
 0:000>  !address 768bf86a
 ProcessParametrs 00511400 in range 00510000 0054b000
 Environment 005107e8 in range 00510000 0054b000
    768a0000 : 768a1000 - 00068000
                    Type     01000000 MEM_IMAGE
                    Protect  00000020 PAGE_EXECUTE_READ
                    State    00001000 MEM_COMMIT
                    Usage    RegionUsageImage
                    FullPath C:\Windows\system32\USER32.dll
 0:000>  !address 4b9dc4d5
 ProcessParametrs 00511400 in range 00510000 0054b000
 Environment 005107e8 in range 00510000 0054b000
    10011000 : 10011000 - 6325f000
                    Type     00000000
                    Protect  00000001 PAGE_NOACCESS
                    State    00010000 MEM_FREE
                    Usage    RegionUsageFree
The first address 0011fe30 is the start of a frame on the call stack, and the !address command consequently reports this address being in a stack range, also reporting which thread owns that stack.
The second address 0051213a comes from a value on the stack, and it is not immediately clear where it points to. The !address command tells us that this is a heap address, and it also reports the handle for the owning heap. This handle can then be used as an argument to the !heap command in order to find out more about that heap.
The third address 768bf86a is stored as a return address in the call stack, so we would expect it to point to executable code for some loaded module. The !address command confirms this and it also reports which module (user32.dll in this case) contains that address.
Note: executable code does not necessarily fall in the in-memory image of loaded modules: this is the case, for instance, with .NET code, which is compiled just-in-time at runtime from Intermediate Language (IL) code to machine code.
Last, the value 4b9dc4d5, also found on the stack, does not point to allocated memory, and the !address command indicates this by displaying the usage RegionUsageFree.
A first look at the crash dump
Let's open the dump of the process at crash time and have a look.
The call stack:
 0:016> kb50
ChildEBP RetAddr  Args to Child
049aa218 7c827d0b 77e61d1e 000007ac 00000000 ntdll!KiFastSystemCallRet
049aa21c 77e61d1e 000007ac 00000000 049aa260 ntdll!NtWaitForSingleObject+0xc
049aa28c 77e61c8d 000007ac 0001d4c0 00000000 kernel32!WaitForSingleObjectEx+0xac
049aa2a0 6951163f 000007ac 0001d4c0 049ac350 kernel32!WaitForSingleObject+0x12
049aa308 69506136 049ae350 049ac350 00000088 faultrep!MyCallNamedPipe+0x15b
049ae764 69508b5c 049af858 049af38c 00000001 faultrep!StartManifestReport+0x1d5
049af5b0 77e7650f 049af858 00000001 c0000005 faultrep!ReportFault+0x3d2
049af80c 77bc3e74 049af858 00000000 00000000 kernel32!UnhandledExceptionFilter+0x494
049af82c 77bcb547 c0000005 049af858 77bc6cd5 msvcrt!_XcptFilter+0x178
049af838 77bc6cd5 049af860 00000000 049af860 msvcrt!_endthreadex+0xba
049af860 7c828752 049af944 049affa8 049af960 msvcrt!_except_handler3+0x61
049af884 7c828723 049af944 049affa8 049af960 ntdll!ExecuteHandler2+0x26
049af92c 7c82855e 049a5000 049af960 049af944 ntdll!ExecuteHandler+0x24
049af92c 7c82a754 049a5000 049af960 049af944 ntdll!KiUserExceptionDispatcher+0xe
049afc38 7c82a82b 00030000 00323030 049afd00 ntdll!RtlpCoalesceFreeBlocks+0x36e
049afd20 77bbcef6 00030000 00000000 04b0e060 ntdll!RtlFreeHeap+0x38e
049afd68 61494feb 04b0e060 04ce3320 00000001 msvcrt!free+0xc3
WARNING: Stack unwind information not available. Following frames may be wrong.
049afd80 61494fac 04b02d20 00000001 04ce83f0 oran9+0x14feb
049afd9c 61494f8f 04ce3320 00000001 029bb838 oran9+0x14fac
049afdb8 61494f8f 04ce83f0 00000001 04c49e80 oran9+0x14f8f
049afdd4 61494fac 029bb838 00000001 77bbce33 oran9+0x14f8f
049afdf0 614950d8 04c49e80 00000000 049afe14 oran9+0x14fac
049afe00 61401fda 04c49e80 028e56d0 00000000 oran9+0x150d8
049afe14 614015ef 04c05acc 04bd9a18 04bd9a00 oranl9+0x1fda
049afe30 614bee6d 04bd9a00 04bd99e0 02959b40 oranl9+0x15ef
049afe44 614bed0c 04bd9a18 04bd99e0 00000001 oran9+0x3ee6d
049afeb0 6148f77c ffffffff 00000000 00000000 oran9+0x3ed0c
049afedc 6071631e 03dbb60c 00000000 00000000 oran9+0xf77c
049afefc 606f3e92 03dbb568 03dbb300 03dbb528 oraclient9+0x11631e
049aff10 606aed21 03dbb568 049aff2c 606ad7f9 oraclient9+0xf3e92
049aff1c 606ad7f9 03dbb568 0278fc20 049aff38 oraclient9+0xaed21
049aff2c 027c2095 03dbb528 049aff50 4c9bcf5a oraclient9+0xad7f9
049aff38 4c9bcf5a 03dbb528 7739cf99 00000000 ociw32+0x2095
049aff50 4c9bd296 03dbb300 00000000 02983bc0 msorcl32!ServiceOCIWorkRequest+0x74
049aff84 77bcb530 03dbb300 00000000 00000000 msorcl32!OCIWorkerThreadFunc+0x57
049affb8 77e64829 00038198 00000000 00000000 msvcrt!_endthreadex+0xa3
049affec 00000000 77bcb4bc 00038198 00000000 kernel32!BaseThreadStart+0x34
tells us that an exception occurred while executing ntdll!RtlpCoalesceFreeBlocks (see ntdll!KiUserExceptionDispatcher executing on top of it). There wasn't an exception handler for it so we resorted to the unhandled exceptions filter (kernel32!UnhandledExceptionFilter), whose handling of the exception involved Windows Error Reporting (see faultrep!ReportFault on the stack), which took the dump. Then the process was terminated.
The first step is to restore the context of the exception. kernel32!UnhandledExceptionFilter takes an EXCEPTION_POINTERS argument, whose second argument is the CONTEXT structure with the context information of our exception.
 0:016> dd 049af858 L2
049af858  049af944 049af960
 0:016>  .cxr 049af960
eax=04b0e070 ebx=00030000 ecx=00323030 edx=31203a72 esi=04b0e068 edi=04b0e058
eip=7c82a754 esp=049afc2c ebp=049afc38 iopl=0         nv up ei ng nz na pe cy
cs=001b  ss=0023  ds=0023  es=0023  fs=003b  gs=0000             efl=00010287
ntdll!RtlpCoalesceFreeBlocks+0x36e:
7c82a754 8b09            mov     ecx,dword ptr [ecx]  ds:0023:00323030=????????
 0:016> kb50
ChildEBP RetAddr  Args to Child
049afc38 7c82a82b 00030000 00323030 049afd00 ntdll!RtlpCoalesceFreeBlocks+0x36e
049afd20 77bbcef6 00030000 00000000 04b0e060 ntdll!RtlFreeHeap+0x38e
049afd68 61494feb 04b0e060 04ce3320 00000001 msvcrt!free+0xc3
WARNING: Stack unwind information not available. Following frames may be wrong.
049afd80 61494fac 04b02d20 00000001 04ce83f0 oran9+0x14feb
049afd9c 61494f8f 04ce3320 00000001 029bb838 oran9+0x14fac
049afdb8 61494f8f 04ce83f0 00000001 04c49e80 oran9+0x14f8f
049afdd4 61494fac 029bb838 00000001 77bbce33 oran9+0x14f8f
049afdf0 614950d8 04c49e80 00000000 049afe14 oran9+0x14fac
049afe00 61401fda 04c49e80 028e56d0 00000000 oran9+0x150d8
049afe14 614015ef 04c05acc 04bd9a18 04bd9a00 oranl9+0x1fda
049afe30 614bee6d 04bd9a00 04bd99e0 02959b40 oranl9+0x15ef
049afe44 614bed0c 04bd9a18 04bd99e0 00000001 oran9+0x3ee6d
049afeb0 6148f77c ffffffff 00000000 00000000 oran9+0x3ed0c
049afedc 6071631e 03dbb60c 00000000 00000000 oran9+0xf77c
049afefc 606f3e92 03dbb568 03dbb300 03dbb528 oraclient9+0x11631e
049aff10 606aed21 03dbb568 049aff2c 606ad7f9 oraclient9+0xf3e92
049aff1c 606ad7f9 03dbb568 0278fc20 049aff38 oraclient9+0xaed21
049aff2c 027c2095 03dbb528 049aff50 4c9bcf5a oraclient9+0xad7f9
049aff38 4c9bcf5a 03dbb528 7739cf99 00000000 ociw32+0x2095
049aff50 4c9bd296 03dbb300 00000000 02983bc0 msorcl32!ServiceOCIWorkRequest+0x74
049aff84 77bcb530 03dbb300 00000000 00000000 msorcl32!OCIWorkerThreadFunc+0x57
049affb8 77e64829 00038198 00000000 00000000 msvcrt!_endthreadex+0xa3
049affec 00000000 77bcb4bc 00038198 00000000 kernel32!BaseThreadStart+0x34
The call stack above is the one which brought to the exception. Just forgot: which exception are we talking about? Here it is:
 0:016>  .exr 049af944
ExceptionAddress: 7c82a754 (ntdll!RtlpCoalesceFreeBlocks+0x0000036e)
   ExceptionCode: c0000005 (Access violation)
  ExceptionFlags: 00000000
NumberParameters: 2
   Parameter[0]: 00000000
   Parameter[1]: 00323030
Attempt to read from address 00323030
The argument to msvcrt!free, 04b0e060, is the address that the application is freeing. msvcrt!free calls ntdll!RtlFreeHeap to do the real job, because the C Runtime Heap is implemented on top of the operating system heap. In order to understand what's happening up in our call stack, a bit of background information is needed.
A couple of relevant things about heaps
The first important thing we need to be aware of is that the data structures of the operating system heap changed in Vista and Windows Server 2008, so we need to check which operating system this process was running on. The ever-useful !vertarget command comes to the rescue:
 0:016> vertarget
Windows Server 2003 Version 3790 (Service Pack 2) MP (8 procs) Free x86 compatible
Product: Server, suite: Enterprise TerminalServer SingleUserTS
Machine Name:
Debug session time: Wed Oct 15 11:44:02.000 2008 (GMT+1)
System Uptime: not available
Process Uptime: 0 days 5:01:05.000
  Kernel time: 0 days 0:06:49.000
  User time: 0 days 0:04:21.000
So this is Windows Server 2003 and we can forget about the new data structures introduced in later operating systems. Nonetheless, if you are interested, you can find more details in the book "Advanced Windows Debugging", authors Mario Hewardt and Daniel Pravat.
Another thing we need to know is that ntdll!RtlpCoalesceFreeBlocks(), showing up at the top of the call stack, is called when a block of heap memory is freed and the heap manager detects that there are adjacent blocks that are also free. In this case, the 2 or 3 adjacent blocks are merged into one, larger free block, so as to reduce heap fragmentation. The access violation occurring in ntdll!RtlpCoalesceFreeBlocks() therefore indicates that, while manipulating the heap data structures to merge bocks, we ran into a bad address. This in turn is an indication that some of those data structures bacame corrupted some time earlier.
So at this point we can conclude that the crash was caused by a corruption of a heap in the process. This, alone, may be enough to set up some standard troubleshooting steps, like for example enabling the page heap for the process.
However, as it is often the case in troubleshooting, the deeper we go in our analysis, the more we'll be able to devise an effective set of "next steps" to take. In some cases, a careful comparison of this in-depth analysis with the source code of the application can even allow to identify and fix the bug directly. So let's take the pain of looking into the details of the heap blocks.
Narrowing down the corruption
The above considerations on the structure of a process memory comes into play here. The address 04b0e060 that we are trying to free is part of a heap. The !address command, indeed, confirms that. If we want more details on what this address means in the heap, we need to switch to the !heap command. In particular, !heap with the -x option allows us to find out the information about the heap block that address belongs to:
 0:016>  !heap -x 04b0e060
List corrupted: (Blink->Flink = 00000000) != (Block = 04b0e060)
HEAP 00030000 (Seg 04a90000) At 04b0e058 Error: block list entry corrupted

Entry     User      Heap      Segment       Size  PrevSize  Unused    Flags
-----------------------------------------------------------------------------
04b0e058  04b0e060  00030000  04a90000        10        20         a  free last
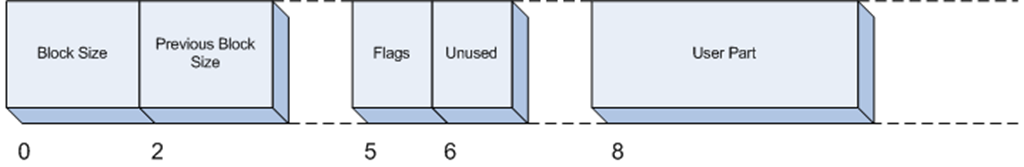
The fields above are basically those of the internal HEAP_BLOCK data structure. The block starts at address 04b0e058, 8 bytes are taken by the header of the block (the HEAP_BLOCK structure), so the address of the user memory is 04b0e060. Those fields will be relevant for our analysis:
- Size: the size, in bytes, of this block. Note that, since the header takes 8 bytes, size 0x10 means that 8 bytes were allocated by the caller of HeapAlloc()
- PrevSize: the size of the previous block. Note that, since blocks are layed out without holes in the heap, Size and PrevSize allows us to move from block to block. For example, we now know that the next block is at address 04b0e058+10 = 04b0e068 and that the previous block is at address 04b0e058-20 = 04b0e038
- Flags: there are different flags for a heap block. free means that this block is marked as free. Free blocks are placed in the free list. The free list is a linked list of blocks that are available for reuse. Pointers to previous and next elements in the linked list are kept in the user part of the heap block, in this case starting at address 04b0e060. This is always possible because the user-allocated part of a heap block is at least 8 bytes and, once a block is free, that part is no longer used. This guarantees that we can always store 2 addresses there, which we can call the Blink and Flink of the free list.
We can also dump out the heap block header manually to figure out the offset of those fields in the HEAP_BLOCK structure:
 0:016> dd 04b0e058 L2
04b0e058  00040002 030a10f2
So Size (0x2, expressed in 8-byte units) is at offset 0, PrevSize (0x4, again in 8-byte units) is at offset 2, Flags (0x10) is at offset 5 and Unused (0x0a) is at offset 6:
With this information in our hands, let's now try and understand the first 2 lines of the !heap -x output above. BLink->Flink means to go back to the previous entry in the free list and then follow its FLink. So let's manually dump out the BLink of our block:
 0:016> dd 04b0e060 L1
04b0e060  00000000
So this is 0, which explains the message that came from the debugger. This does not mean, however, that this is a real corruption in the heap: the bookkeeping data structures of a heap may be inconsistent while they are being modified by the heap manager, because they are in a transient state. And here, since ntdll!RtlFreeHeap is executing, calling ntdll!RtlpCoalesceFreeBlocks, we are, indeed, modifying those data structures. In particular, the heap manager has already marked the entry as free (this is done in RtlHeapFree before calling RtlpCoalesceFreeBlocks), but its FLink and BLink have not been set yet (note that, if this block will be merged with a previous block, FLink and BLink won't be set at all).
So let's ignore that debugger message and let's progress in the search of the problem that caused the process crash. ntdll!RtlpCoalesceFreeBlocks looks at nearby blocks in order to check whether a block merge is possible so let's check whether the nearby heap blocks are healthy. Previous block:
 0:016>  !heap -x 04b0e038
List corrupted: (Blink->Flink = 00000000) != (Block = 04b0e060)
HEAP 00030000 (Seg 04a90000) At 04b0e058 Error: block list entry corrupted

Entry     User      Heap      Segment       Size  PrevSize  Unused    Flags
-----------------------------------------------------------------------------
04b0e038  04b0e040  00030000  04a90000        20        38         8  busy
Apart for the usual message, the block appears a valid one. Note in particular that its size (20) matches the PrevSize of the following block. Following block:
 0:016>  !heap -x 04b0e068

List corrupted: (Blink->Flink = 00000000) != (Block = 04b0e060)
HEAP 00030000 (Seg 04a90000) At 04b0e058 Error: block list entry corrupted
Mmmhh..., no output for the next block. Could this be an indication that there is a problem with the next heap block? Since the debugger command was not of much use, let's dump out the block header manually, then interpret it by using the offsets that we figured out previously.
 0:016> dd 04b0e068 L2
04b0e068  00020004 6f727245
So Size = 4 * 8 = 0x20, at offset 0, PrevSize = 2 * 8 = 0x10 at offset 2. These appear to be valid values. In particular, PrevSize matches with Size of the previous block.
The second byte of the block header, however, does not look good: Flags = 0x72 at offset 5 is not a valid combination of flags, and Unused = 0x72 at offset 6 is also invalid.
04b0e06c=04b0e068+4, therefore, seems to be the address where we first notice a corruption. In this case, it is useful to try and read the memory starting at that address in different formats, so as to detect possible patterns. In this particular case, we see that the bytes 0x45, 0x72, 0x72 and 0x6f that are at address 04b0e06c seem to fall in the range of valid ANSI characters so the first attempt is to read the memory as an ANSI string:
 0:016> da 04b0e06c
04b0e06c  "Error: 1002"
Bingo!! We found a string where it should not have been, overwriting part of a heap block header. This block is next to the one we are freeing, so the crash occurs when ntdll!RtlpCoalesceFreeBlocks() inspects it to check if it can be merged with the previous one. It is also interesting to note that we came to this conclusion without the need to look into the code (disassembly) of ntdll!RtlFreeHeap or ntdll!RtlpCoalesceFreeBlocks.
Going further
The corruption is in a block next to the one we are freeing, so the call stack is not of much help because it refers to the freeing of a different block. This is one manifestation of the problem that I mentioned at the beginning of the article: the cause of the memory corruption occurred earlier and we are now only experiencing its symptoms. Backtracking to the source of the corruption is not easy. Nonetheless, let's have a look at the additional steps that we can take.
First, we can detect the extent of the corruption. Since the corrupted block size is 0x20, we can check whether the next block is valid:
 0:016> dd 04b0e088 L2
04b0e088  00040004 030801e8
So yes, this appears to be a valid header (Size 0x20, PrevSize 0x20, matching the previous block's size, Flags = 1 and Unused = 8).
Second, we may analyze the application's code in search of possible issues with the way it handles errors (in particular, those coming from the data access layer, since "Error: 1002" comes from a database operation).
Should code analysis not be effective in identifying the problem, we may try to follow the chain of pointers in the process memory. The idea is that, in order to write to a memory address, you need to point to it in the first place. So chances are that, in the address space, we are still storing the address 04b0e06c somewhere. We can search for it with the s command:
s -d 0 L?80000000 04b0e06c
Yet another option is to search for the string itself (Error: 1002) in memory. This would cover the case where the string was copied from one place to another.
 0:016> s -a 0 L?80000000 "Error: 1002"
04b0e06c  45 72 72 6f 72 3a 20 31-30 30 32 00 00 00 00 00  Error: 1002.....
We are not lucky in this case: the only instance we found is the one we already know of.
Note: for these searches to be effective, we would need a full dump. In this particular case the dump I was provided was a heap dump (.hdmp) taken by the error reporting tool. This dump contains heap information only, so the results of the searches are limited to heap memory.
Conclusions
The case study showed how to use information on the heap structure in order to identify the corruption which caused a process to terminate. Some of the cheap takeaways of the analysis above:
- !heap -x is a very handy way to find the heap block an address belongs to and to check the integrity of the heap block
- if !heap -x or other debugger command reports a corruption, that does not mean that the heap is corrupted: if any of the threads in the process are executing code in the heap manager, chances are that the heap data structures are in a transient, invalid state, which is not the result of any corruption
- if !heap -x does not show a heap block because of a corruption, you can dump out its header manually
- identifying the string (or other object) which corrupted the heap requires extra effort, but it usually pays off: with a bit of further analysis you may be able to find and fix the problem without resorting to more invasive troubleshooting tools
- navigating the heap data structures to spot a corruption and get it resolved can be a big fun