FSharpChart release supporting Stacked Charts (version 0.60)
For the second release this week, FSharpChart now supports binding for Stacked Charts. As always, one can download the latest release from:
https://code.msdn.microsoft.com/FSharpChart-b59073f5
In previous versions of FSharpChart it was not very intuitive how a Stacked Chart could be plotted. What one had to do was define a CombinedChart where one defines the charts to be combined with the same StackedGroupName property value:
let rndStacked = new System.Random()
let dataX() = [ for f in 1 .. 10 -> rndStacked.NextDouble() * 10.0]
FSharpChart.Combine
[ FSharpChart.StackedBar100(dataX(), StackedGroupName = "g1")
FSharpChart.StackedBar100(dataX(), StackedGroupName = "g1")
FSharpChart.StackedBar100(dataX(), StackedGroupName = "g1") ]
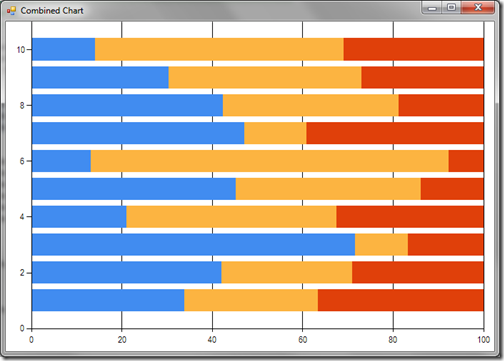
This displays the following chart:
(Thanks to Tomas Petricek for this sample)
This approach also allows one to easily combine multiple Stacked Charts using different StackedGroupName properties:
FSharpChart.Combine
[ FSharpChart.StackedBar(dataX(), StackedGroupName = "g1")
FSharpChart.StackedBar(dataX(), StackedGroupName = "g1")
FSharpChart.StackedBar(dataX(), StackedGroupName = "g1")
FSharpChart.StackedBar(dataX(), StackedGroupName = "g2")
FSharpChart.StackedBar(dataX(), StackedGroupName = "g2") ]
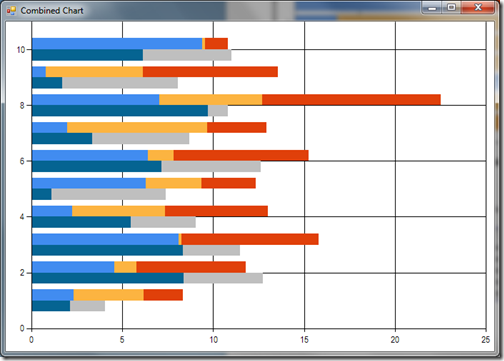
This displays the following chart:
However, for Stacked Charts, a more intuitive approach would be just to specify a list of data series. With this new release one can now specify the data series using the following formats:
list<list<'TY>>
list<list<'TX * 'TY>>
This now allows one to define, say a StackedColumn chart, using the much simpler expression:
let rndStacked = new System.Random()
let dataXY() = [ for f in 1 .. 10 -> (f, round (rndStacked.NextDouble() * 100.0))]
[dataXY(); dataXY(); dataXY()]
|> FSharpChart.StackedColumn
|> FSharpChart.WithSeries.DataPoint(Label="#VAL")
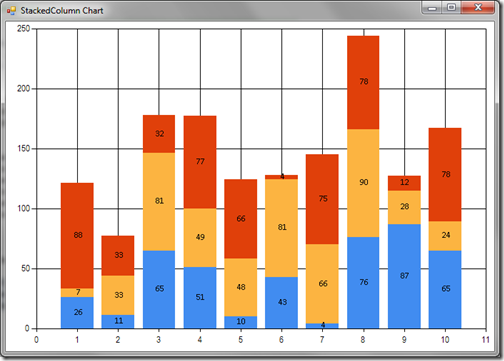
This displays the following chart:
Hopefully you will agree this is much simpler and more intuitive. The only current limitation of this binding approach is that one cannot use a CombinedChart for multiple Stacked Charts when binding in this fashion. If this is the desire then the previous approach with distinct StackedGroupName properties is needed.
The download also includes a new WinForms sample demonstrating how bindings can be managed for these Stacked Charts.
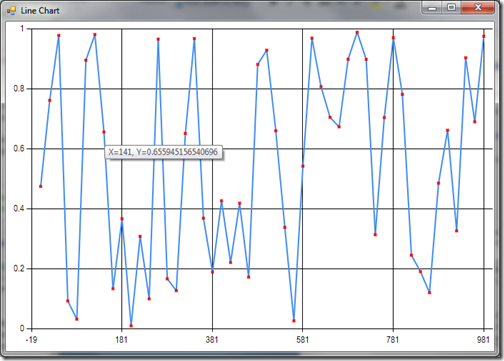
Don’t forget, the previous release also added the ability to add a Marker for a Data Series:
[ for i in 1. .. 20. .. 1000.0 -> i, rnd.NextDouble() ]
|> FSharpChart.Line
|> FSharpChart.WithSeries.Marker(Color=Color.Red, Style=MarkerStyle.Cross)
Again, the this displays the chart:
Once again enjoy!


