Diagnostics in AD FS 2.0
AD FS 2.0 RC has a number of enhancements and additions for troubleshooting/diagnostics of failures and errors that occur when processing token issuance requests.
Imagine a scenario
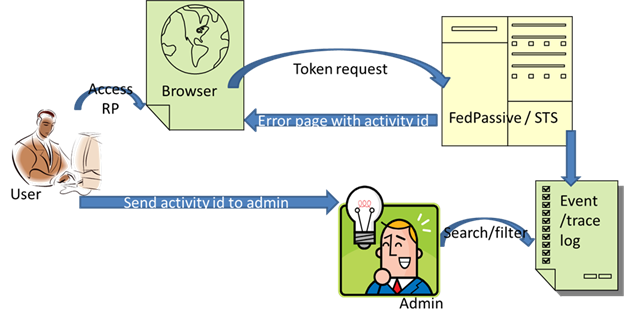
A user accesses a Relying Party (RP) which redirects to AD FS 2.0 federation service for a token. An error occurs at the federation service. The federation service returns an error.
The user contacts admin/support. The admin/support is faced with the following challenges.
- How to figure out the reason for failure from event log by using standardized procedures? What to look for in the event and trace logs which could potentially have hundreds of events?
- Are there events that log the caller identity information corresponding to the failure?
- Is there an easy way to correlate multiple event log events that could be logged for the same failure? (Especially across the passive client web application and the WS-Trust STS).
- Is there an easy way to correlate multiple trace log traces for the request leading up to the failure?
- In the case of AD FS 2.0 deployment scenario involving a federation server proxy, can the failure events be correlated across machine boundaries between the proxy and the federation service?
Fortunately AD FS 2.0 logs detailed events and traces to help easy diagnosis of failures when faced with the above challenges. Also the various events and traces logged for a token issuance request can be correlated using activity ID (this ID is same for the duration of the request) and hence a meaningful picture of the token issuance processing can be obtained. I will give an introduction to these diagnostic features in the following sections.
ETW framework for logging events and traces
Starting with RC, AD FS 2.0 events and traces are logged using Event Tracing for Windows (ETW) framework. ETW is a general-purpose, high-speed tracing facility provided by the operating system. For more information on ETW, refer to https://msdn.microsoft.com/en-us/magazine/cc163437.aspx .
AD FS 2.0 Event log
In Pre-RC builds of AD FS 2.0, the events logged by AD FS 2.0 were available in the application event log and viewable in event viewer under Windows Logs\Application. Starting with RC this will not be the case anymore. The AD FS 2.0 events are now available under a separate node “AD FS 2.0 Eventing\Admin” (note that this node name is likely to change in the RTM version) under Applications and Services Log in event viewer.
This isolation of AD FS 2.0 events enables easier diagnosis and viewing of AD FS 2.0 events. Also it enables ACL’ing and securing events for viewable by specific groups of users.
AD FS 2.0 Trace log
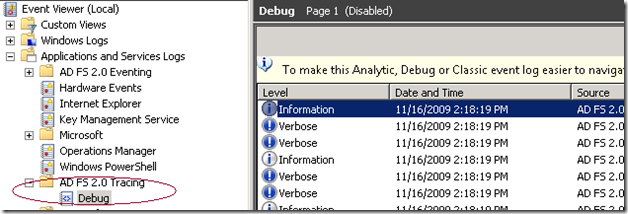
In Pre-RC builds of AD FS 2.0, the traces logged by AD FS 2.0 were logged using .Net tracing. Setting up and receiving these traces would involve manually modifying the Microsoft.IdentityServer.ServiceHost.exe.config file to set up trace listeners. These traces could be viewed in notepad or other custom tools depending on the type of the trace listener configured (xml, text etc). This also requires a service restart for the trace changes to take effect. Obviously, this approach is error prone and causes service disruption. Starting with RC, AD FS 2.0 uses ETW framework to log traces as well. The traces logged are accessible for viewing under a separate node “AD FS 2.0 Tracing\Debug” under Applications and Services Log in event viewer.
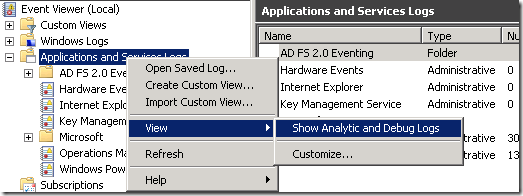
Note that unlike AD FS 2.0 event log, the AD FS 2.0 trace log is not viewable in event viewer by default. To view the trace log node, Right click on “Applications and services Logs” and select “View” and “Show Analytic and Debug Logs” option. After this is done, the “AD FS 2.0 Tracing” node becomes visible.
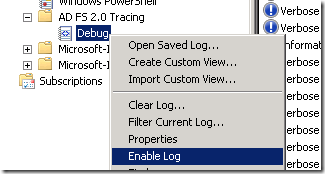
The Trace log is not enabled by default since hundreds of trace messages could potentially be logged for each token request that arrives at the STS. Trace logging has to be enabled explicitly by right clicking the “Debug” node and selecting “Enable Log” option.
Similarly the trace logging can be disabled by right clicking the “Debug” node and selecting “Disable Log” option.
By default, the trace log file size is configured to be 50 MB and the log is not circular. These properties can be changed by right clicking the “Debug” node and selecting “Properties” option.
Note that the trace messages in trace log are not localized. They always appear in the English language. This is because trace messages are mostly for debugging purpose when traditional event logs don’t give sufficient information to figure out the error and so more advanced and detailed messages logged by AD FS 2.0 code needs to be dug into. Not all the messages logged in trace logs are expected to make meaningful sense to customers (admin/support) looking at them, but there are some specific traces (for example those that print out the claims transformation rule, input claims, evaluation claims, output claims etc) with distinct event IDs that can be looked at to troubleshoot specific errors in detail.
WCF and WIF (Windows Identity Foundation) trace messages
Sometimes it may be necessary to look at WCF and WIF trace messages to troubleshoot a failure. Since WCF and WIF use .Net tracing, correlating the AD FS 2.0 traces with the traces from WCF and WIF can become a challenge. Hence AD FS 2.0 allows WCF and WIF traces to be logged in the AD FS 2.0 trace log side by side with AD FS 2.0 traces. Enabling this is as simple as opening the Microsoft.IdentityServer.ServiceHost.Exe.Config file and enabling the corresponding trace sources as shown below (by setting the appropriate trace switchValue) and restarting the AD FS 2.0 service.
<system.diagnostics>
<sources>
<!-- To enable WIF tracing, change the switchValue below to desired trace level - Verbose, Information, Warning, Error, Critical -->
<source name="Microsoft.IdentityModel" switchValue="Off"> … </source>
<!-- To enable WCF tracing, change the switchValue below to desired trace level - Verbose, Information, Warning, Error, Critical -->
<source name="System.ServiceModel" switchValue="Off" > … </source>
</sources>
</system.diagnostics>
Once the traces are enabled by setting the appropriate switches, WIF traces will appear in the AD FS 2.0 trace log under the keyword ADFSWIF and WCF traces appear in the trace log under the keyword ADFSWCF.
Correlating events and traces using Activity ID and Caller ID
When an error happens during processing of a single token issuance request by the STS, there could be multiple errors logged by STS and Federation passive web application in the event log. Furthermore, there could be multiple errors logged corresponding to different token issuance requests by different users. Hence it becomes difficult to analyze a particular request failure due to the sheer volume of events that could be present in the logs. Hence AD FS 2.0 correlates all events in event log corresponding to a particular request by using a unique GUID (globally unique identifier) called Activity ID. This ID is generated when the token issuance request comes to Federation Passive web application (passive scenarios) or directly to STS (active scenarios) and remains the same for the entire duration of the request. This Activity ID is logged as part of every event that is logged by AD FS 2.0 for that request. Hence by filtering (or searching) the event log by the activity ID can help figure out all the related events corresponding to the token request. The same activity ID is logged across different machines in case of Proxy STS based deployment scenarios as well enabling cross-machine troubleshooting based on events and traces.
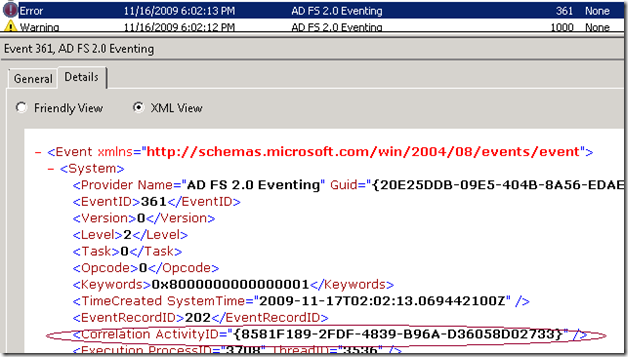
Note that that the same activity ID is logged as part of trace messages as well. Hence one can correlate all the events and traces corresponding to a request by using the activity ID. The activity ID is logged as an attribute under the Correlation XML element of the event xml.
This is viewable under the Details section of the event in the event log. The trace log trace also has the Activity ID logged under the Correlation XML element.
All this is great but there is one critical question as to how does one know which activity ID corresponds to the token request we want to debug? That is where the caller ID event comes into picture. The caller ID event is a special event logged in event log (warning event with Event ID 1000) during token issuance failures. It contains the claim type and value of at most one of the following claim types if available in the caller identity information that is passed in as part of token request.
- "https://schemas.microsoft.com/ws/2008/06/identity/claims/windowsaccountname"
- "https://schemas.xmlsoap.org/ws/2005/05/identity/claims/nameidentifier"
- "https://schemas.xmlsoap.org/ws/2005/05/identity/claims/upn"
- "https://schemas.microsoft.com/ws/2008/06/identity/claims/upn"
- "https://schemas.xmlsoap.org/claims/UPN"
- "https://schemas.xmlsoap.org/ws/2005/05/identity/claims/emailaddress"
- "https://schemas.microsoft.com/ws/2008/06/identity/claims/emailaddress"
- "https://schemas.xmlsoap.org/claims/EmailAddress"
- "https://schemas.xmlsoap.org/ws/2005/05/identity/claims/name"
- "https://schemas.microsoft.com/ws/2008/06/identity/claims/name"
- "https://schemas.xmlsoap.org/ws/2005/05/identity/claims/privatepersonalidentifier"
Note that the caller ID event also has the activity ID logged as described above and so by searching for specific claim values corresponding to the claim types listed above, we can locate the activity ID in Caller ID event and use that activity ID to filter/search the event log and trace log corresponding to all events and traces for that request.
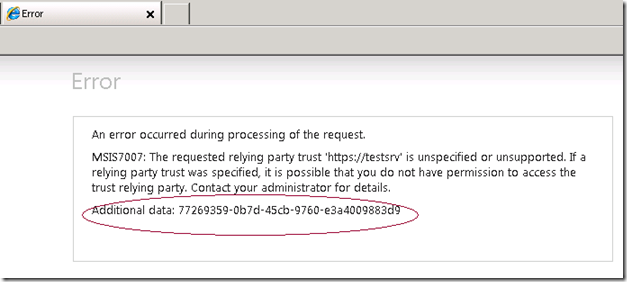
There is also a way to get the activity ID from the user for whom the failure occurred in browser based scenarios. When the passive client web application shows the generic error page with the error message, it also shows the activity ID corresponding to the failure. So, the user that sees the failure can communicate the activity ID to admin/support and then it becomes trivial for the admin/support personnel to search the event log using the activity ID to locate the error events and traces (if trace is enabled) corresponding to the failure.
Searching / filtering of events
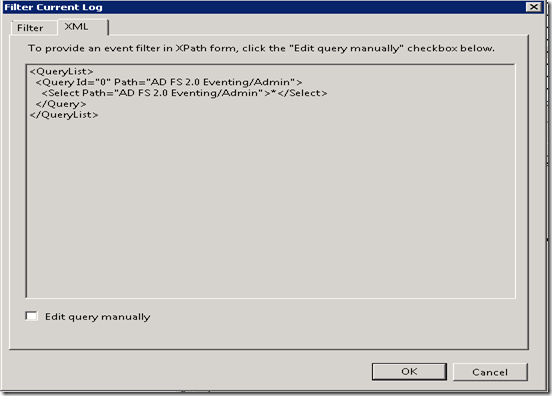
Here are some basic ways to search / filter events and traces in logs using event viewer. The simplest way is to right click on the log node and select “Find..” option to open the Find dialog box and typing in the search text (ex: Activity ID) and searching the events. There is also a way to filter the entire log by right clicking the log node and selecting “Filter Current log” option and providing filter options in the dialog box. A powerful option available to filter events is under the XML tab of the Filter Current Log dialog. Since events and traces are logged as structured XML, XPath queries can be written to filter the log based on different data present in the event/trace XML.
For example, the XPath query can be as shown below to filter the event log using a specific activity ID
<QueryList>
<Query Id="0" Path="AD FS 2.0 Eventing/Admin">
<Select Path=" AD FS 2.0 Eventing/Admin ">*[System[Correlation[@ActivityID='{ 77269359-0b7d-45cb-9760-e3a4009883d9}']]]</Select>
</Query>
</QueryList>
AD FS 2.0 Audits
Apart from events and traces, AD FS 2.0 also logs a bunch of audit events in the Windows Security Log. The source name for these audits is AD FS 2.0 Auditing. These audits are typically logged (if enabled) during success and failure of Management and token issuance operations.
Balaji. A.
Software Design Engineer
AD FS 2.0 team

