System Center Operations Manager PowerShell grid Widget, create an effective dashboard targeted to service owner/contact:
Hi There
Steve here, posting a blog entry for my colleague Arif the great OpsMgr PFE. He doesn't have access to our blog yet, but we'll rectify that soon. So posting some great material on his behalf.
Enjoy.
Steve
-------------------------------------------------
Visualization in System Center Operations Manager or SCOM in general: people knows SCOM as centralized place to get alerts, to get real time information of what happening with their Systems or Services. One-way that we really can help people express and share the understand of their data is by creating Visualization around that.
In this blog, I will show, one way of creating an effective dashboard in SCOM and bring in the data, not from SCOM databases, but from external source.
With the release of UR2 for System Center 2012 R2 and UR6 for System Center 2012 SP1, Microsoft included updates for the Widgets which allow you to create richer dashboard visualization within Operations Manager. This dashboard infrastructure consists of dashboard, widgets and the data source to pull the data from, either from Operations Manager or external data sources. More information about the new list of Widgets can be found here: https://social.technet.microsoft.com/wiki/contents/articles/24133.operations-manager-dashboard-widgets.aspx.
Two of the more interesting new Widgets in my opinion are the PowerShell Grid Widgets and PowerShell Web Browser Widget, or you can say "Extensibility widgets":
These 2 widgets, are really powerful widgets, expends and customized to your heart contents. these widgets allow you to visualize what you want to show on your dashboard.
PowerShell Grid Widget, displays the result of a PowerShell Script in a grid. Enter your PowerShell script and data retuned in grid format inside the Operations Manager Console. As the data return from the PS are shown in grid, and sometimes we may have to scroll through using the bar, which are not a good option for a dashboard. However, when PS is the best or the only option to get data, PS Grid is the most effective way to create the dashboard;
lot of examples are available and community members have developed fantastic dashboards using PowerShell widgets and PowerShell web widgets, Browse to: https://aka.ms/scomdashboards.
Before I go to the dashboard demo, I would like to talk about the context or scenario, I will do the demo on.
In System Center we make heavy use of Business Services, because this is how we represent the IT deliverables to the business.
Think of it as something that IT delivers to the business in the way the business understands it. Intranet, email, voice, warehouse automation would be examples of a service consumed by the business and delivered by IT.
In System Center Service Manager and Operations Manager we leverage the concept of the services. In Service Manager we articulate the service in our Business Service listing in the CMDB.
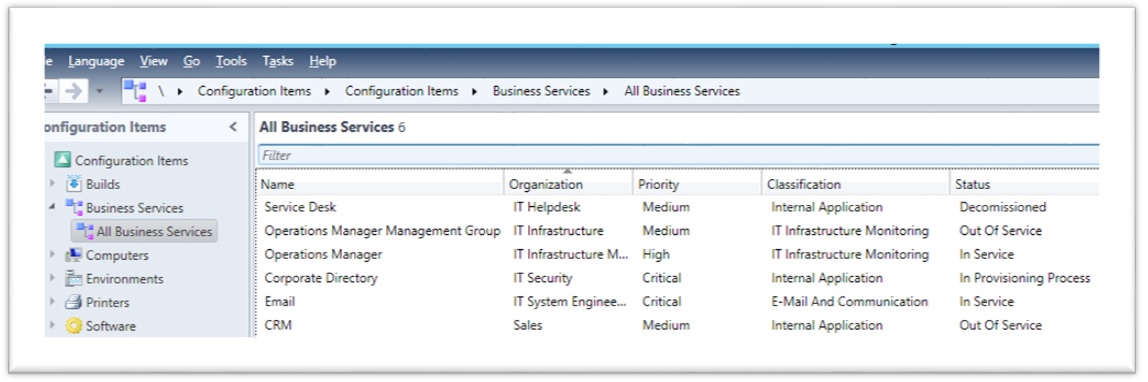
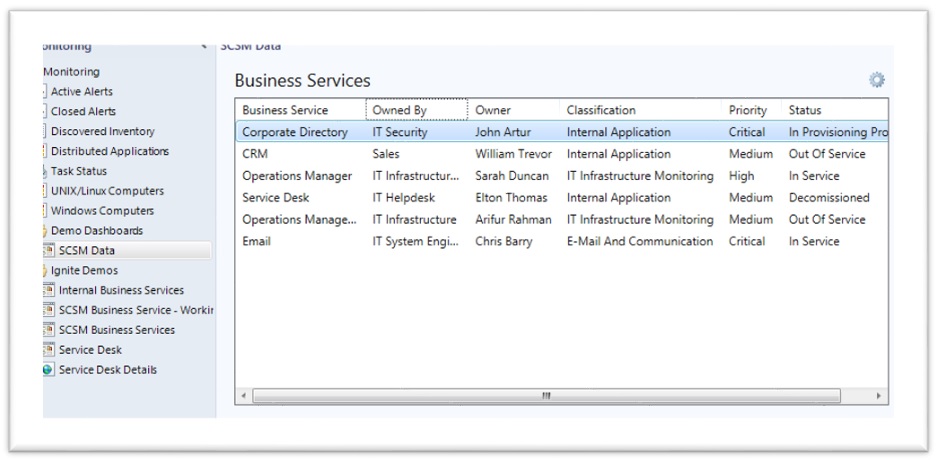
In my example, I have System Center Service Manager (SCSM) 2012 R2 setup and have few business services defined. You can see several
individual services, each of which are listed with a different function, priority, etc.
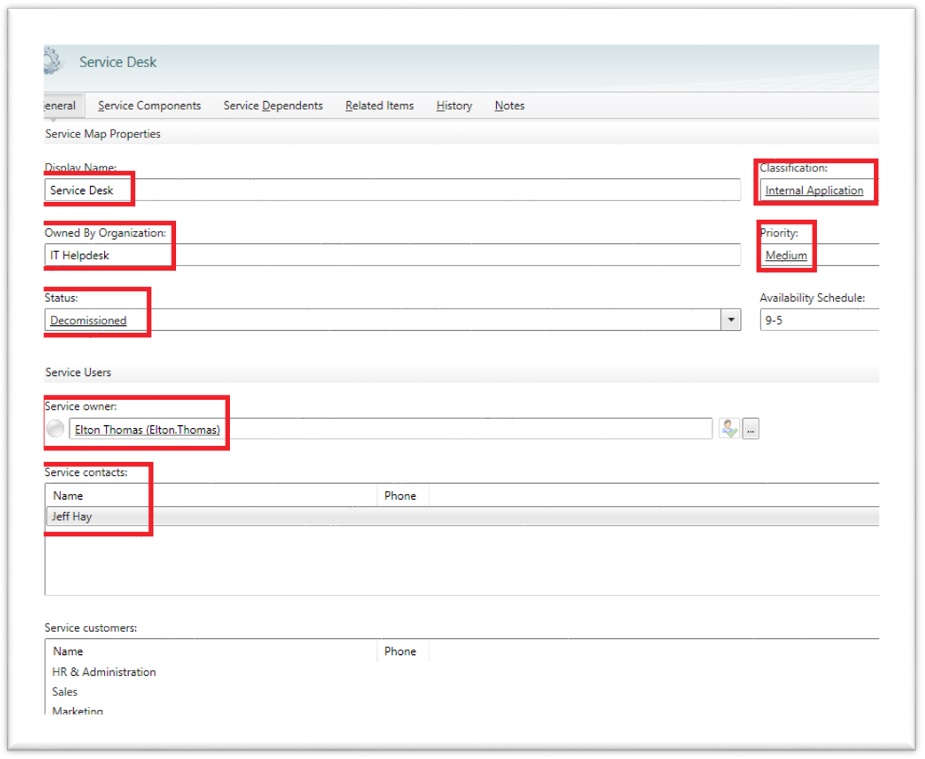
As we open a service, such as Service Desk, you can see how it has included detailed contact, priority, service owner, contact person and
business information. It also provides the information to IT Analysts or service owner, who want to know the configuration of a business service.
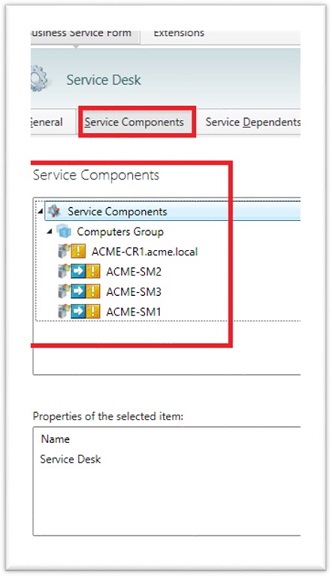
And if we click on the “Service Components” tab, we can see the list of components this business service has. For this demo purpose, I am only limited the components to Computer Objects, however a business service can have any type of objects, e.g. physical storage, network device etc. and in the SCSM, we can add those type of service components.
Now, back to the SCOM, my object for this demo is to create a dashboard for service owners, bringing the defined information from SCSM. For
this, I will use SCOM dashboard PowerShell Grid widget.
Let’s start. In the SCOM Console:
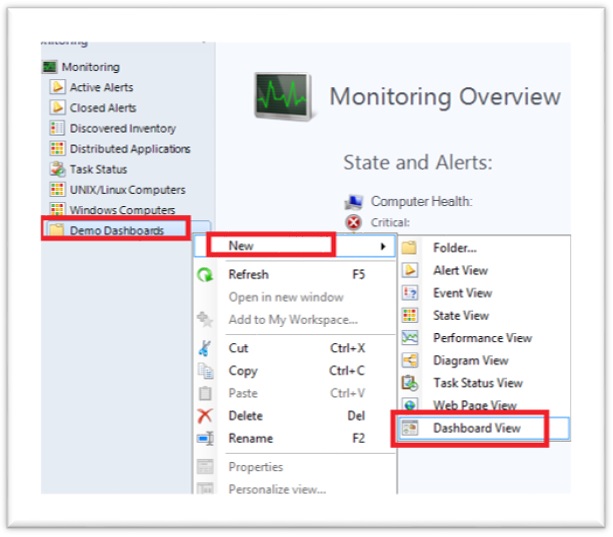
1. Create a new Management Pack (MP) from the Administration tab. For my demo, I named it “Demo Dashboards”
2. Once you create the MP, a new folder will appear under your Monitoring tab. Add a new 4-Cells Grid Layout view to the
folder.
New -> Dashboard View -> Microsoft -> Grid Layout
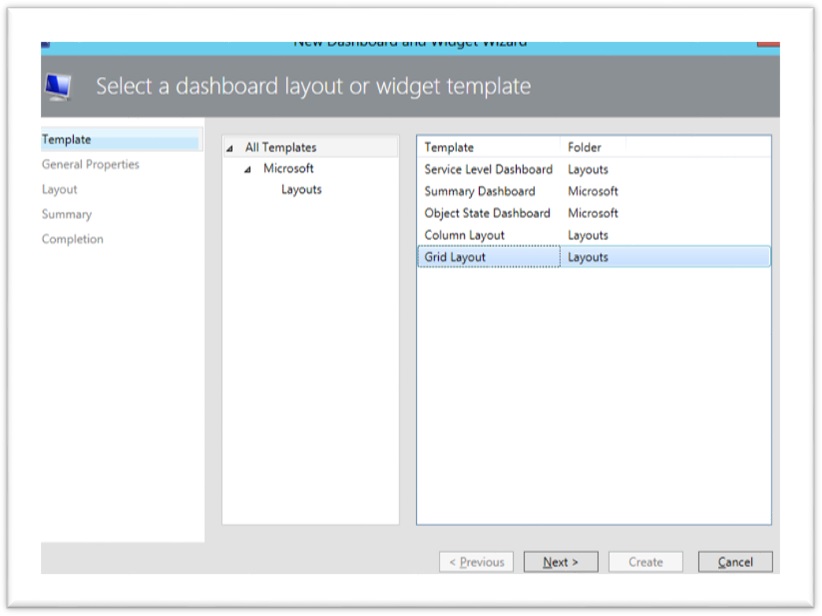
3. Enter a name for the dashboard, for my example “SCSM Data’

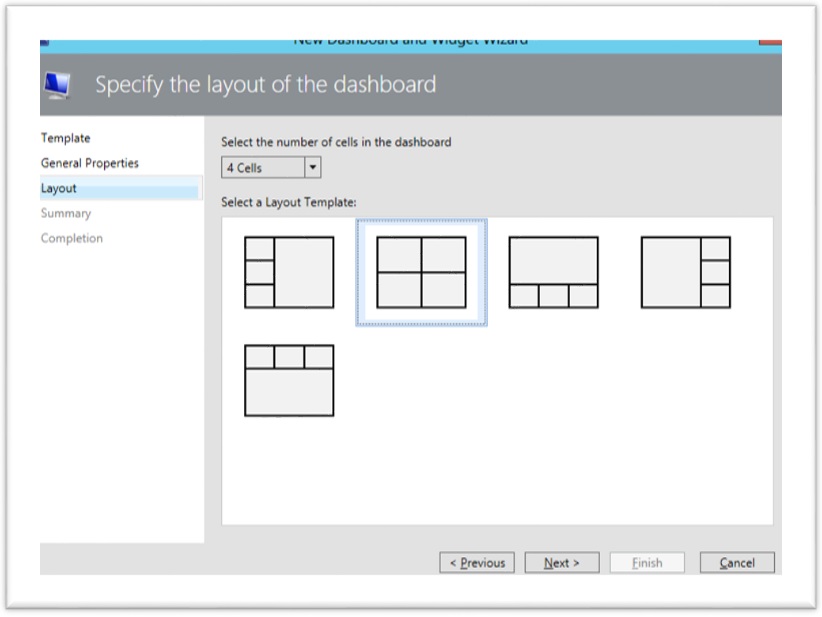
4. Select 4-Cells and Create the dashboard.
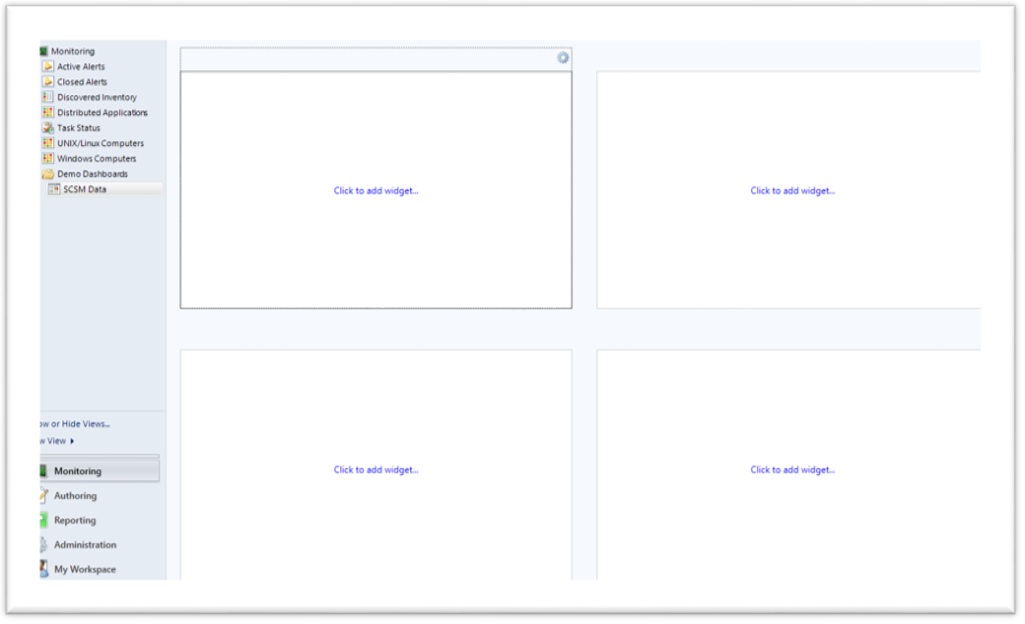
Time to start populating the grid with data from SCSM.
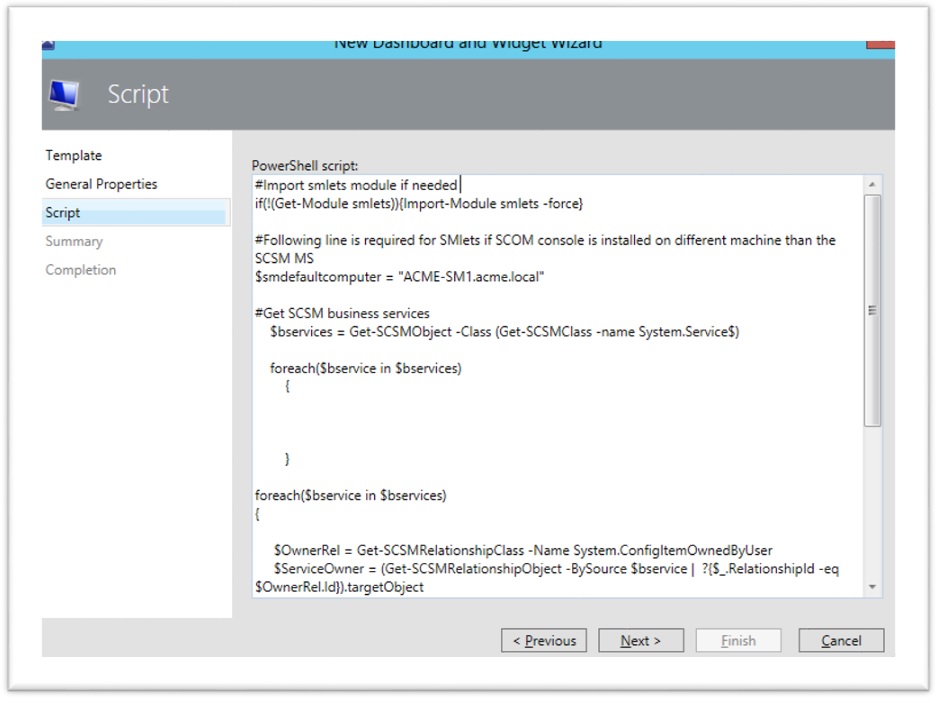
In the first grid, I want to show, all defined business services from the SCSM. Click on Click to add widget in the first grid and select PowerShell Grid
Widget and click Next.
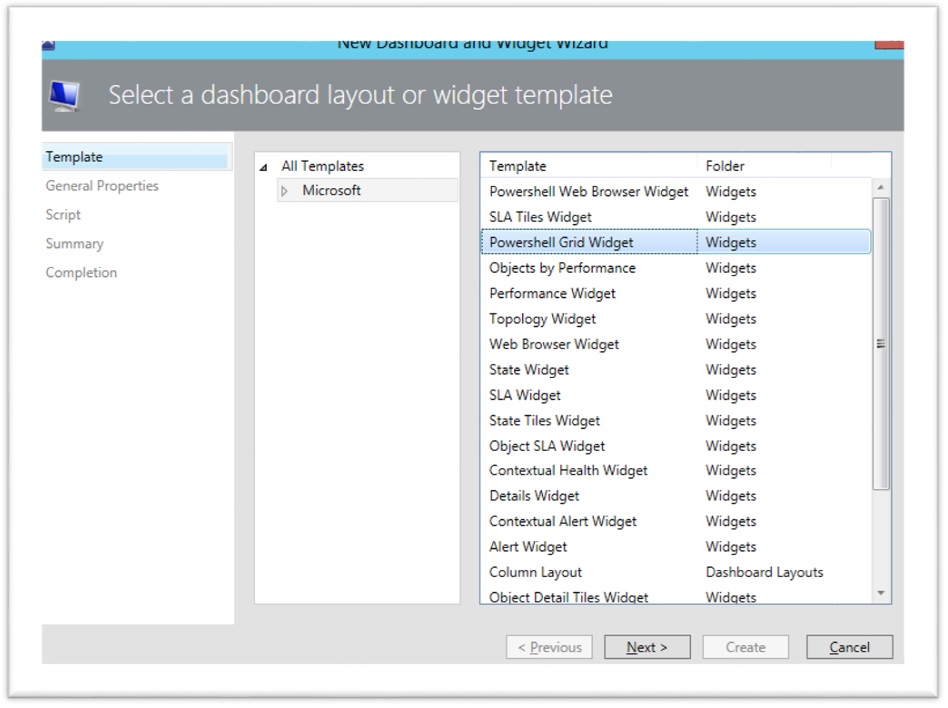
5. Name the Widget. This name be shown on above the grid. I named mine to “Business Services”. Click Next

6. Copy and paste the PowerShell Script from the downloaded file, Get_Busniess_Services section at the bottom
7. The PowerShell Grid Widget will show the Business Services from SCSM
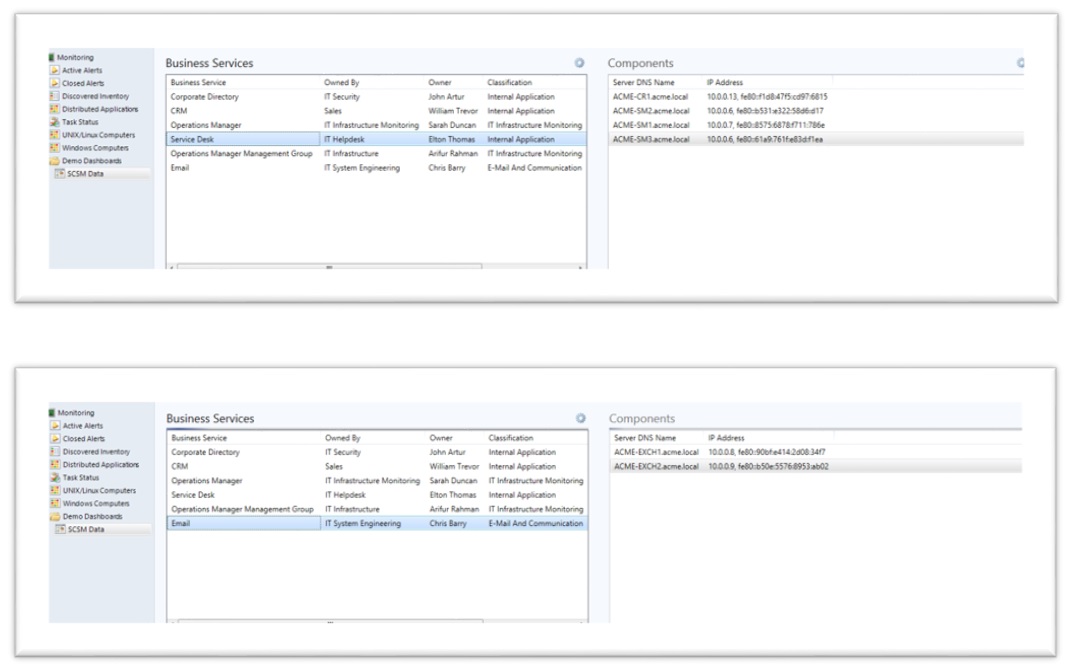
In the second Grid, I want to show all the components of the business service selected in the first grid. Follow the above procedure to add the PowerShell Grid Widget and copy the script from “Business_Services_Components” section. I named the Grid “Components”. Once done, if we select any business service in the first grid, the second grid will show all the related components of he selected business service.
8. Since SCSM is an ITSM process management tool and record the incident and I have configured integration between SCOM and SCSM, hence I have a SCSM incident for any alert for computer object in SCOM. In the third Grid, I want to show all the active incident from the SCSM for the
select server object in grid 2. Follow the same procedure to add the PowerShell Grid Widget and copy the script from “Active_Incidents” section. I named the Grid “Active Incident”. Once done, if we select any server object in the second grid, the third grid will show all the related active incidents from the SCSM for the selected server.
9. Next, in the last grid, I want to show all changes from SCSM related to selected server in grid 2. This will help service owner, to identify, if there is any change that has caused the incident related to selected server. Service owner can also see the upcoming changes for the selected server that will impact the business service, the server is a component of. Follow the same procedure to add the PowerShell Grid Widget and copy the script from “Changes” section. I named the Grid “Related Changes”.
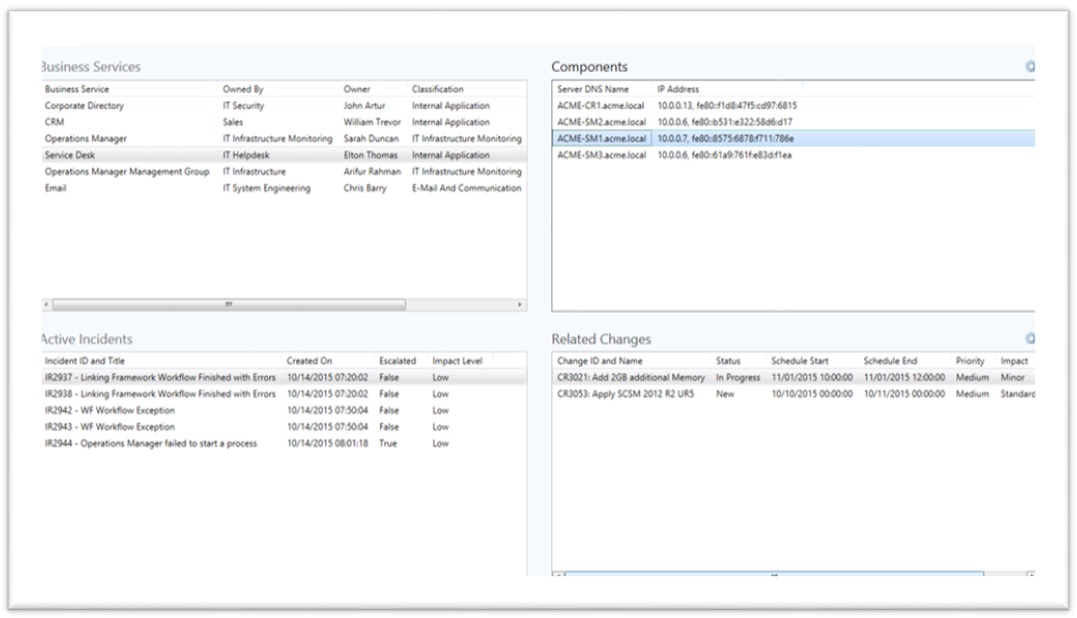
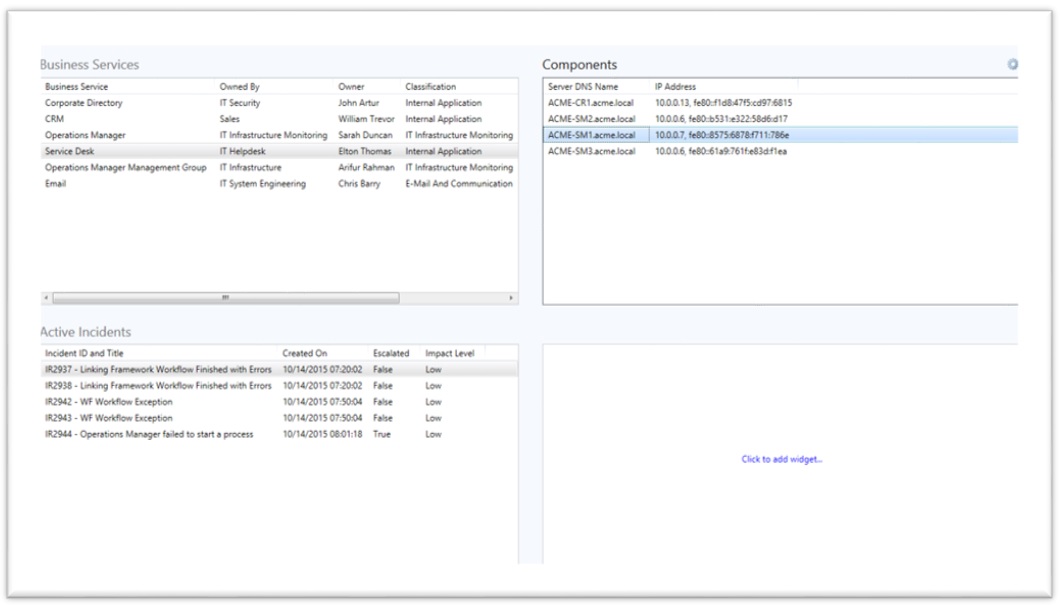
If we select different business service in the first grid and different server component in the second server, we will see the related incident and changes in grid 3 and 4 respectively.
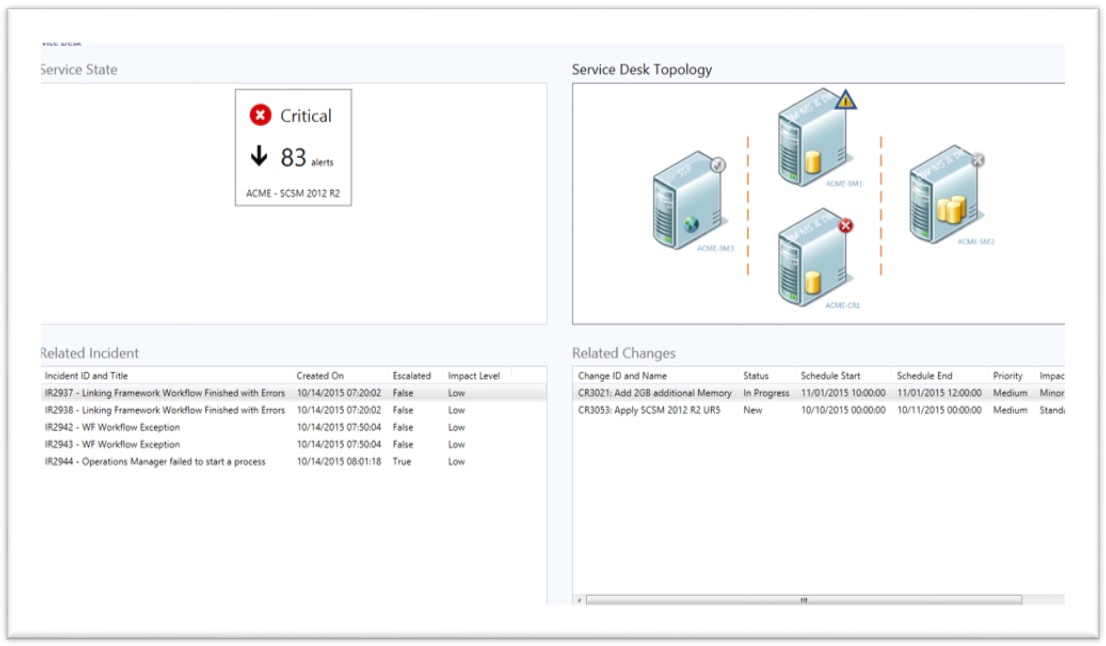
In this blog, we have seen, how we can use SCOM PowerShell grid widget to bring in the information from external data source to build an effective dashboard for service owner or service contact. Shown below is an example of the service oriented dashboard which can be target to the service owner.
Thanks to Christian (https://blogs.technet.com/b/servicemanager/archive/2013/09/18/scsm-console-extensions-impacted-business-services.aspx), Marcel (https://marcelzehner.ch/2013/10/05/from-ci-to-parent-business-service-beta-version/#more-2723) and Knut (https://itblog.no/2382) for the great idea and Cmdlets scripts.
Happy OpsMgr'ing
Arif
PS here is the script referenced in the blog.