Debugger features help to find memory leaks
You can use the debugger $CALLSTACK and TracePoints to find memory leaks.
Memory leaks are very tedious to find. Often they don’t affect an application at all except a gradual performance slowdown on a customer machine. Leaks can be found in old code bases that have multiple authors over years, with different programming styles and rules. It may not be clear with public and internal APIs who is responsible for freeing a resource such as or a Window Handle.
Managed leaks are typically due to references not being freed, such as event handlers, or collections that aren’t cleared.
Native leaks are often from allocation ownership rules not being clear or not being followed. There are many native string types, each with its own rules (e.g. OLESTR, CComBSTR, _Bstr_t, basic_string, CString) Not using SmartPointers consistently or wisely can lead to trouble.
Native interop with managed code is a third category of code that can leak, with its own complex rules, such as Marshaling and reference counting.
Below is a simple program in C# that allocates some memory but doesn’t free all of it, simulating a leak. Routing all allocations and frees into a single class makes it easier to track them. The code simulates a leak in native memory, but could also simulate a managed memory leak (such as unbounded growth of a collection)
We can use the Debugger’s Tracepoint feature to dump values and callstacks to the output window to track the memory allocations.
File->New->Project->C#->Windows ->Console Application. Paste in the code below.
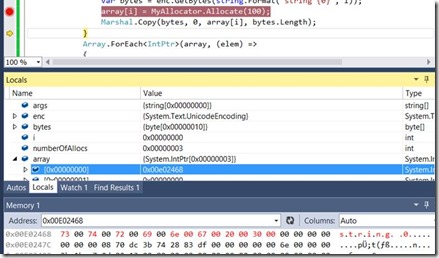
At a breakpoint, I can step through the code, open a Memory Window (Debug->Windows->Memory->1 ) drag the allocation address (Array[0]) to the Memory Window and see the values actually being copied to the allocated memory (Hit F10 to execute the Marshal.Copy line:
Put a TracePoint (Breakpoint->When Hit->Print a Message) on the alloc with this expression: “Alloc {nTotCnt} {nSize} {ret} $CALLSTACK”
This will output to the Output Window the Allocation Sequence Number, size, address and callstack for each allocation.
And one on the free with this expression: “Free {nTotCnt} {ptr}”
Show the Total count and the address being freed.
Here’s the full output:
Alloc 0x00000000 0x00000064 0x00698cc8 ConsoleApplication1.exe!ConsoleApplication1.MyAllocator.Allocate
ConsoleApplication1.exe!ConsoleApplication1.Program.Main.AnonymousMethod__0
mscorlib.dll!System.Array.ForEach<System.IntPtr>
ConsoleApplication1.exe!ConsoleApplication1.Program.Main
[Native to Managed Transition]
mscorlib.dll!System.AppDomain.ExecuteAssembly
Microsoft.VisualStudio.HostingProcess.Utilities.dll!Microsoft.VisualStudio.HostingProcess.HostProc.RunUsersAssembly
mscorlib.dll!System.Threading.ThreadHelper.ThreadStart_Context
mscorlib.dll!System.Threading.ExecutionContext.RunInternal
mscorlib.dll!System.Threading.ExecutionContext.Run
mscorlib.dll!System.Threading.ExecutionContext.Run
mscorlib.dll!System.Threading.ThreadHelper.ThreadStart
Alloc 0x00000001 0x00000064 0x00698b08 ConsoleApplication1.exe!ConsoleApplication1.MyAllocator.Allocate
ConsoleApplication1.exe!ConsoleApplication1.Program.Main.AnonymousMethod__0
mscorlib.dll!System.Array.ForEach<System.IntPtr>
ConsoleApplication1.exe!ConsoleApplication1.Program.Main
[Native to Managed Transition]
mscorlib.dll!System.AppDomain.ExecuteAssembly
Microsoft.VisualStudio.HostingProcess.Utilities.dll!Microsoft.VisualStudio.HostingProcess.HostProc.RunUsersAssembly
mscorlib.dll!System.Threading.ThreadHelper.ThreadStart_Context
mscorlib.dll!System.Threading.ExecutionContext.RunInternal
mscorlib.dll!System.Threading.ExecutionContext.Run
mscorlib.dll!System.Threading.ExecutionContext.Run
mscorlib.dll!System.Threading.ThreadHelper.ThreadStart
Alloc 0x00000002 0x00000064 0x00698d38 ConsoleApplication1.exe!ConsoleApplication1.MyAllocator.Allocate
ConsoleApplication1.exe!ConsoleApplication1.Program.Main.AnonymousMethod__0
mscorlib.dll!System.Array.ForEach<System.IntPtr>
ConsoleApplication1.exe!ConsoleApplication1.Program.Main
[Native to Managed Transition]
mscorlib.dll!System.AppDomain.ExecuteAssembly
Microsoft.VisualStudio.HostingProcess.Utilities.dll!Microsoft.VisualStudio.HostingProcess.HostProc.RunUsersAssembly
mscorlib.dll!System.Threading.ThreadHelper.ThreadStart_Context
mscorlib.dll!System.Threading.ExecutionContext.RunInternal
mscorlib.dll!System.Threading.ExecutionContext.Run
mscorlib.dll!System.Threading.ExecutionContext.Run
mscorlib.dll!System.Threading.ThreadHelper.ThreadStart
Alloc 0x00000003 0x00000064 0x00698b78 ConsoleApplication1.exe!ConsoleApplication1.MyAllocator.Allocate
ConsoleApplication1.exe!ConsoleApplication1.Program.Main
[Native to Managed Transition]
mscorlib.dll!System.AppDomain.ExecuteAssembly
Microsoft.VisualStudio.HostingProcess.Utilities.dll!Microsoft.VisualStudio.HostingProcess.HostProc.RunUsersAssembly
mscorlib.dll!System.Threading.ThreadHelper.ThreadStart_Context
mscorlib.dll!System.Threading.ExecutionContext.RunInternal
mscorlib.dll!System.Threading.ExecutionContext.Run
mscorlib.dll!System.Threading.ExecutionContext.Run
mscorlib.dll!System.Threading.ThreadHelper.ThreadStart
Alloc 0x00000004 0x00000064 0x00699048 ConsoleApplication1.exe!ConsoleApplication1.MyAllocator.Allocate
ConsoleApplication1.exe!ConsoleApplication1.Program.Main
[Native to Managed Transition]
mscorlib.dll!System.AppDomain.ExecuteAssembly
Microsoft.VisualStudio.HostingProcess.Utilities.dll!Microsoft.VisualStudio.HostingProcess.HostProc.RunUsersAssembly
mscorlib.dll!System.Threading.ThreadHelper.ThreadStart_Context
mscorlib.dll!System.Threading.ExecutionContext.RunInternal
mscorlib.dll!System.Threading.ExecutionContext.Run
mscorlib.dll!System.Threading.ExecutionContext.Run
mscorlib.dll!System.Threading.ThreadHelper.ThreadStart
Alloc 0x00000005 0x00000064 0x00698e18 ConsoleApplication1.exe!ConsoleApplication1.MyAllocator.Allocate
ConsoleApplication1.exe!ConsoleApplication1.Program.Main
[Native to Managed Transition]
mscorlib.dll!System.AppDomain.ExecuteAssembly
Microsoft.VisualStudio.HostingProcess.Utilities.dll!Microsoft.VisualStudio.HostingProcess.HostProc.RunUsersAssembly
mscorlib.dll!System.Threading.ThreadHelper.ThreadStart_Context
mscorlib.dll!System.Threading.ExecutionContext.RunInternal
mscorlib.dll!System.Threading.ExecutionContext.Run
mscorlib.dll!System.Threading.ExecutionContext.Run
mscorlib.dll!System.Threading.ThreadHelper.ThreadStart
Free 0x00000005 0x00698b78
Free 0x00000004 0x00699048
Free 0x00000003 0x00698e18
By observation, one can see from the output that there are leftover allocations: namely those numbers 0, 1 and 2. Allocations 3-5 are freed, in reverse order.
Obviously the resulting output window text can be quite large, especially if the program is non-trivial.
If the size of the leak is known, you can make your tracepoint conditional based on size to reduce the data.
The Allocation class can be further enhanced by
1. keeping track of allocations by size
2. tracking allocations by type: e.g. another parameter could be an ENUM describing for what part of the application the allocation is used, so we can say, e.g., the reporting or database part of the application is leaking.
3. The allocator can be swapped out for another, perhaps more efficient allocator. E.g. instead of calling Marshal.AllocCoTaskMem, HeapAlloc can be used via P/Invoke
4. You can modify the allocator to dump callstacks to a file, perhaps conditionally
var stackFrames = (new StackTrace()).GetFrames();
5. You can modify the allocator to keep track of all outstanding allocations, perhaps storing their callstacks into a collection. When an allocation is freed, discard the allocation from tracking.
6. Modify the allocator to allocate the size requested plus additional space, into which you can store custom information, such as the Sequence number, thread, etc. This could be perhaps for DEBUG builds.
The results in the output window can be further processed by pasting them into a file and processing that file by parsing the callstacks into groups and matching the Allocs and the Frees.
See also
Use a Custom Allocator for your STL container
Managed code using unmanaged memory: HeapCreate, Peek and Poke
What is your computer doing with all that memory? Write your own memory browser
Overload Operator new to detect memory leaks
<code>
 using System;
using System.Collections.Generic;
using System.Linq;
using System.Runtime.InteropServices;
using System.Text;
using System.Threading.Tasks;

namespace ConsoleApplication1
{
  class Program
  {
    static void Main(string[] args)
    {
      int numberOfAllocs = 3;
      // declare an array
      var array = new IntPtr[numberOfAllocs];
      // allocate 100 bytes per memory allocation
      Array.ForEach<IntPtr>(array, (elem) =>
      {
        elem = MyAllocator.Allocate(100);
      });
      // allocate again, causing leaks
      for (int i = 0; i < numberOfAllocs; i++)
      {
        var enc = new System.Text.UnicodeEncoding();
        var bytes = enc.GetBytes(
            string.Format("string {0}", i)
            );
        array[i] = MyAllocator.Allocate(100);
        Marshal.Copy(bytes, 0, array[i], bytes.Length);
      }
      Array.ForEach<IntPtr>(array, (elem) =>
      {
        MyAllocator.Free(elem);
      });
    }
  }
  public class MyAllocator
  {
    static int nTotCnt;
    public static IntPtr Allocate(int nSize)
    {
      var ret = IntPtr.Zero;
      ret = Marshal.AllocCoTaskMem(nSize);
      nTotCnt++; // Break->When Hit->
      //  Alloc {nTotCnt} {nSize} {ret} $CALLSTACK
      return ret;
    }
    public static bool Free(IntPtr ptr)
    {
      var ret = false;

      Marshal.FreeCoTaskMem(ptr);
      nTotCnt--;
      ret = true; // Break->When Hit->
      //  Free  {nTotCnt} {ptr}
      return ret;
    }

  }
}
</code>
