The Visual Studio Feedback tool
Sometimes when you use Visual Studio, or any application on a computer, there’s a notable pause when you try to do something.
For example, trying to access a file on a network share somewhere, perhaps on a slow connection, the application will seem to be unresponsive for a few seconds. Sometimes, it’s not clear to you what the computer is doing when it becomes unresponsive. Maybe you inadvertently triggered a network search. Or, perhaps, a particular operation that used to take a few seconds now takes ten times longer. Maybe even a background operation started, like a system backup or a virus checker.
There are many ways to examine what exactly your computer is doing.
1. Task Manager can show each process and roughly how much CPU is being used. Ctrl-Shift-Escape will start it on most Windows Versions. On Win8, you might want to choose “More Details” to see a little of what each process is consuming on your machine. Choose the Performance tab, then “Open Resource Monitor” where you can see individual details of what disk files are being accessed, network use, etc. But if a stall is due to a wait, the waiting process will be blocked on the wait and won’t be consuming much CPU or writing to disk. (How to use and troubleshoot issues with Windows Task Manager )
2. Process Explorer shows more details than Task Manager, but along similar lines
3. Process Monitor shows various events that occur in real time on your system. You can filter them to show various operations
4. … lots more
We’ll focus on one method made for Visual Studio, although it actually captures the performance of the entire machine’s operation.
The Visual Studio Feedback Tool https://visualstudiogallery.msdn.microsoft.com/f8a5aac8-0418-4f88-9d34-bdbe2c4cfe72 can be used to collect Event traces (with or without creating a Connect bug).These traces show what each process is doing during the entire trace collection time, which you control with a button.
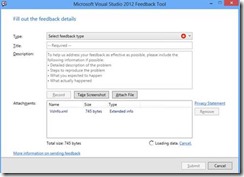
Install it, then choose Help Menu->Report a Bug (sign in with valid Microsoft ID). Once signed in, a systray icon thingy will show. Right clicking it will also allow you to report a bug
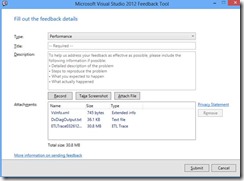
Choose Type->Performance, then you can hit the Record button:
Hitting OK will ask you to restart VS
A little window shows:
Do your scenario click End Record (takes up to 2 minutes)
The ETL trace is automatically added:
You can then enter title, description, and Click Submit.
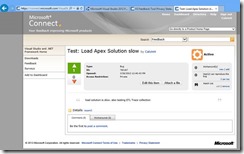
I did this, and within about 30 hours, I got an email from somebody asking me what this was about… Apparently a bug was entered into our database and I could see the traces and other info. I replied that I was just testing the VS Feedback tool pipeline.
It’s nice to see that it worked and reasonably quickly.
Before hitting Submit, the ETL and other files are stored: C:\Users\calvinh\AppData\Local\VSFeedbackTool\Feedbacks\634998987545080153
Clicking “Submit” sends, then deletes the files. Before hitting Submit, you can then open the ETL trace in your favorite ETL viewer, like WPA (https://msdn.microsoft.com/en-us/library/windows/desktop/hh448171.aspx ) or PerfView (https://www.microsoft.com/en-us/download/details.aspx?id=28567 )
Or, if you’re internal to Microsoft, you can copy the ETL to a share and send email/file a bug.
The Solution Fingerprint HTML file contains statistics about a VS solution that was opened, such as Average Refereces/Project, Total # of lines of code, etc. Try double-clicking it to see.


