Project Effort and Cost Tracking Views in AX 2012 R3
In a previous post, I described some of the new features available for editing work break structures in Dynamics AX 2012 R3. In this post, I'll show the new project cost and effort tracking views that enable project managers to keep on top of the progress of their project. To demonstrate, I've created the simple two level work breakdown structure below.
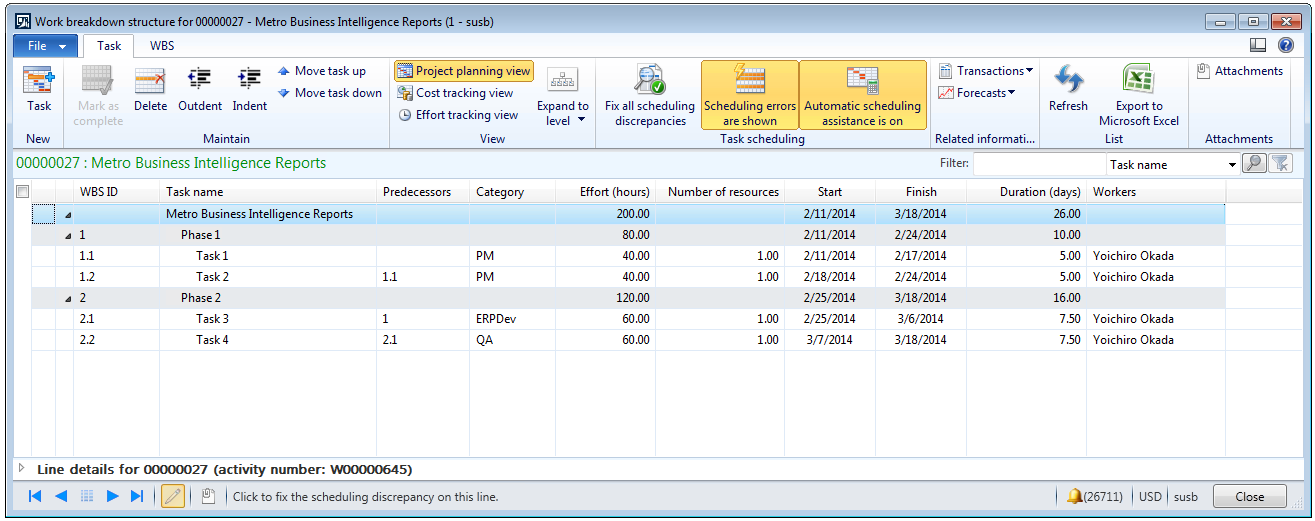
I then posted a timesheet against the project tasks and navigated to the effort tracking view, as seen below. You can get to this view by clicking on the Effort tracking view button on the WBS form or directly via the Control tab on the project list and details forms.
![]()
The values in the Actual effort (hours) column display the hours logged against the tasks from the timesheet. The two columns labeled Progress percent and Remaining effort (hours) are calculated automatically by the system. In this example, 25 hours have been logged against Task 1 out of an estimated 40 resulting in a 62.5% completion percentage and a remaining effort of 15 hours. 50 hours were logged for Task 2, 10 more than the original estimated amount. The red icon in the last column is an indication that I am over the planned estimate for this task.
This information is also reflected in the cost tracking view, available via the ribbon.
![]()
Using the cost price of the reported hours from the timesheet, the system has derived a Cost to complete value for all of the tasks. As expected, Task 2 is exceeding the estimated cost amount and has a warning icon.
Not only can you view the remaining effort and cost in the these tracking views, you can also update them. In the example below, I have set the Remaining effort on Task 1 to 10 hours. The system calculates a Progress percent of 71.43 and sets the Effort at complete to 35 hours (25 actual + 10 remaining). This value is 5 hours below my Planned effort.
![]()
For Task 2, I have clicked the Mark as complete button. This sets the Progress percent to 100, Remaining effort to 0 and Effort at complete to Actual effort (50 hours). As you can see, this is 10 hours above my Planned effort. In addition to marking a leaf node task as complete, you can mark parent tasks and have it cascade to all child tasks.
You can do similar updates in the cost tracking view by updating the Cost to complete column for any task. Here you can see the impact of the updates I made above. Of course, all of the values roll up to the top level of the WBS.
![]()
Combined with the updated project budget tracking view for monitoring project financial performance, these new views give project managers a 360 degree view of their project performance and enable them to quickly make any necessary course corrections.