Tracing in Team Foundation Server 2010
After becoming blurry eyed and looking for two aspirin after reading through mounds of documentation and links on how to enable tracing for TFS 2010, I thought it might be helpful to have one concise blog post to reference. Therefore, while some aspects of tracing are the same for 2008 and 2010, some are not. That said, here’s a quick overview:
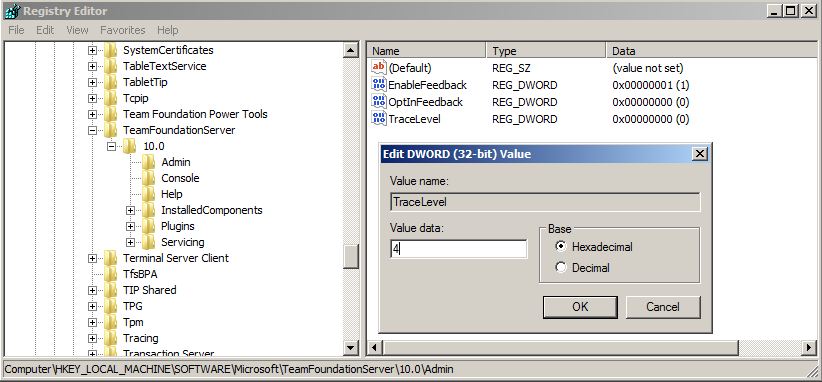
To enable tracing for the configuration tools for TFS 2010 you can change the Trace Level setting within the registry:
There is another way to enable verbosity for 2010 and that’s through the tftrace handler.
https://<tfsserver>:<port>/tfs/tftrace.ashx?[traceWriter=<true|false>][&][All=<traceLevel>]
Note: This is different than the 2008 call:
https://<tfsserver>:<port>/<WebService>/tftrace.aspx?[traceWriter=<true|false>][&][All=<traceLevel>]
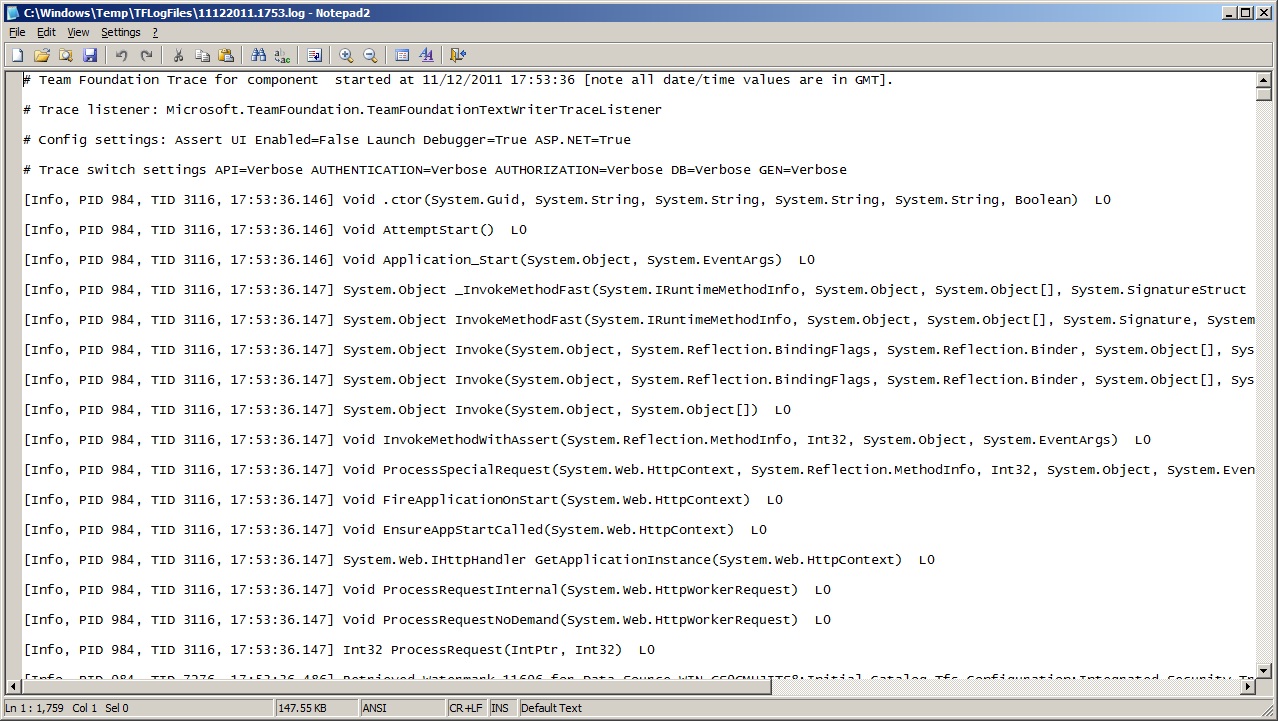
After evoking this command you’ll be presented with a blank page. Yes, a page with no text, graphic or anything. How do you know anything happened? If you check the path defined in the “web.config” (key: traceDirectoryName) which is located in the default install location: “C:\Program Files\Microsoft Team Foundation Server 2010\Application Tier\Web Services”) you should see a log file that was created (e.g. mmddyyyy.# - 11122011.1753.log).
Speaking of log files, there’s a whole host of information to be found in them. For instance, let’s say you want to create a backup plan (which you should always have in place) and receive an error after running the verification checks. In this case I’ve specified a local path instead of a network path as a location to cause an error.
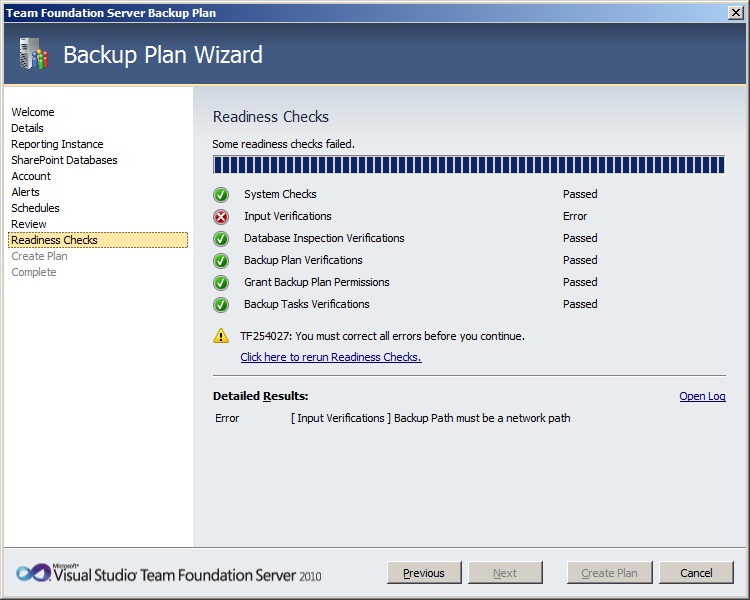
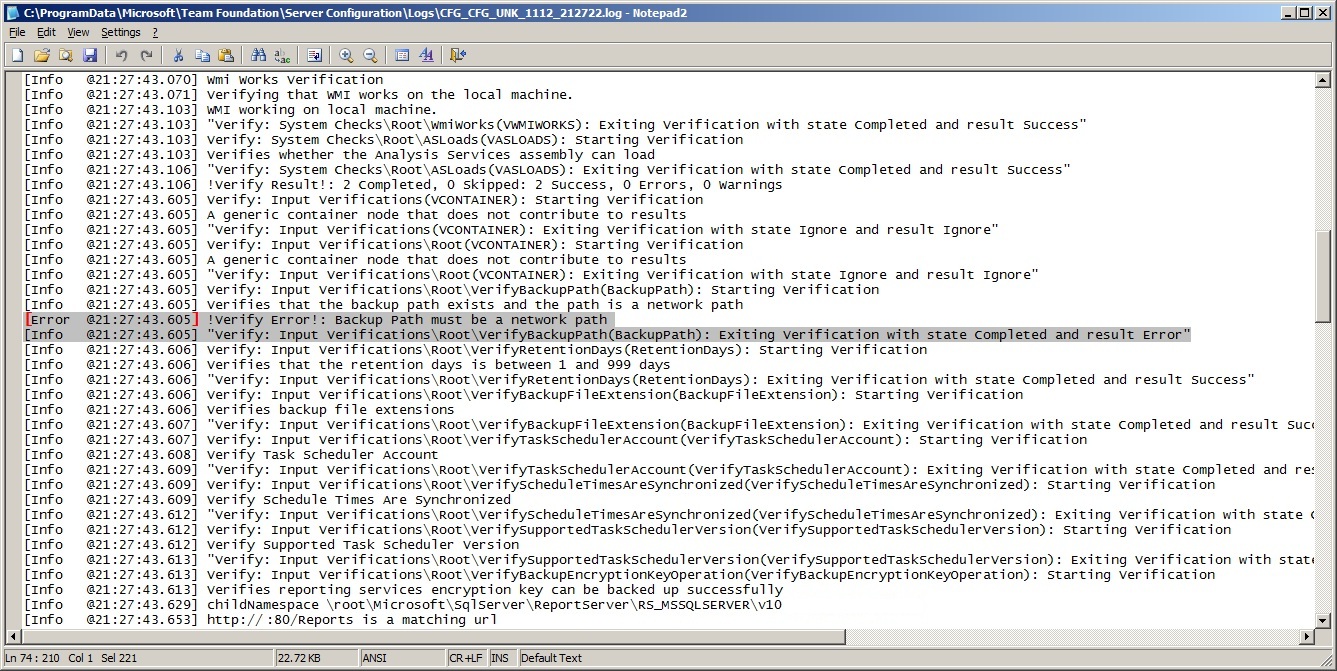
Opening up the log file from the Readiness Checks screen via the “Open Log” link or by going to “Log Files” within the TFS Administration Console, you’ll notice all the errors, warnings and informational messages. This is extremely helpful when trying to pinpoint what’s taking place outside of a generic error dialog.
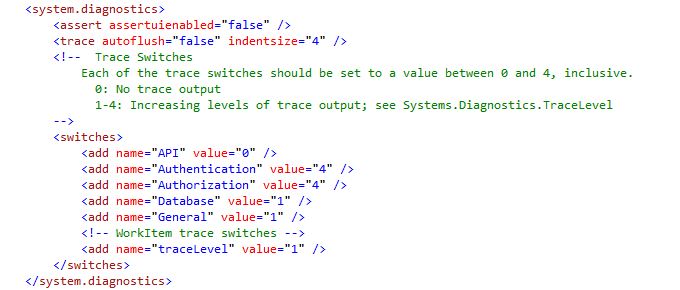
Let’s talk about what options are available within the “web.config” itself regarding tracing. If you go to the aforementioned folder you can modify this configuration file in a number of ways. The first is to specify where the TextWriterTraceListener will save all the data. After that’s set, changing the value of the keys defined in the “switches” section will determine how much data is going to be logged. These values equate to the following:
0 – Off, 1 – Error, 2 – Warning, 3 – Information, 4 – Verbose
So in my example, I’ve turned on tracing for errors concerning the Database and General keys, verbose for Authentication and Authorization and nothing for API.
Notice the log file that's created is slightly different than the standard configuration log files that are generated.
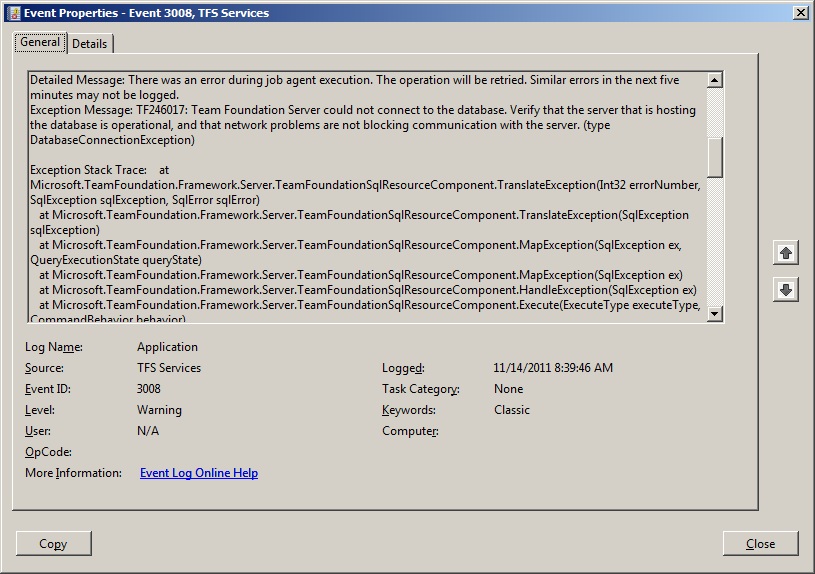
Lastly, the Event Log should always be used as a tool and as you can see, TFS Services logs quite a bit of data which can be used to diagnose and hopefully solve any errors that are occurring.
With the new Visual Studio 11 Developer Preview being released looks like it's time to investigate if there are any refinements to these settings and/or more options that have been added. In the meantime though, there's quite a few ways to obtain detailed tracing information for TFS 2010.