Visual Studio Performance Wizard
Similar to building a high quality application, how the application performs is just as important and is everyone’s responsibility. I mention all parties because while most of the performance tweaking does indeed fall on the development staff (architects, developers, DBA’s, etc.) the business needs to have clear and obtainable requirements prepared. For instance, there’s no sense in building an airplane when in reality the business wants a balloon – both fly but they clearly do it in two different ways.
Having a poorly performing application is the bane of every developer sleeping soundly at night. Therefore performance tuning shouldn’t be a black art conducted only by a few when problems arise but rather it should be a full fledge citizen in the development lifecycle.
Enter the Visual Studio Performance Wizard (VSPW). While there are vendors who sell performance tuning packages, don’t discount the data that can be gleamed from the VSPW or the integration it provides which is essentially out of the box and free.
There are a plethora of features that the VSPW delivers, but let’s go over the basics and I’ll leave the more detailed aspects of it for you to explore.
Walkthrough
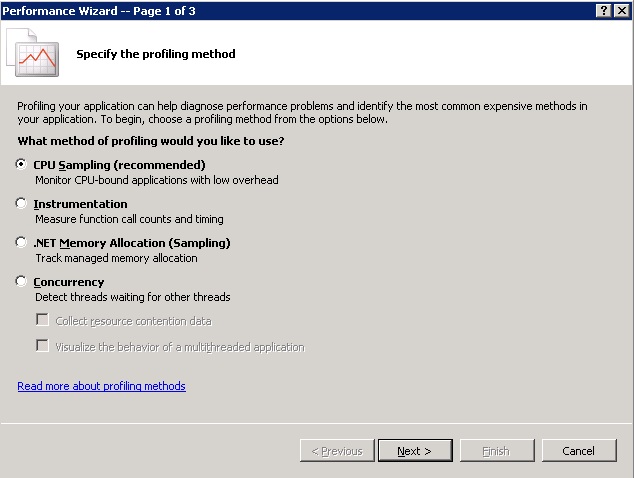
Launching the VSPW is straight forward (on the menu click “Analyze -> Launch Performance Tuning Wizard…”). Here you will go through the following steps, ultimately creating a performance report:
1. Select the profile method (CPU, Instrumentation, Memory Allocation or Concurrency)
2. Select the application (VS project, EXE or ASP.NET/JavaScript application)
3. Select ASP.Net and/or JavaScript specific data capture
4. Launch the profiler
Performance Report
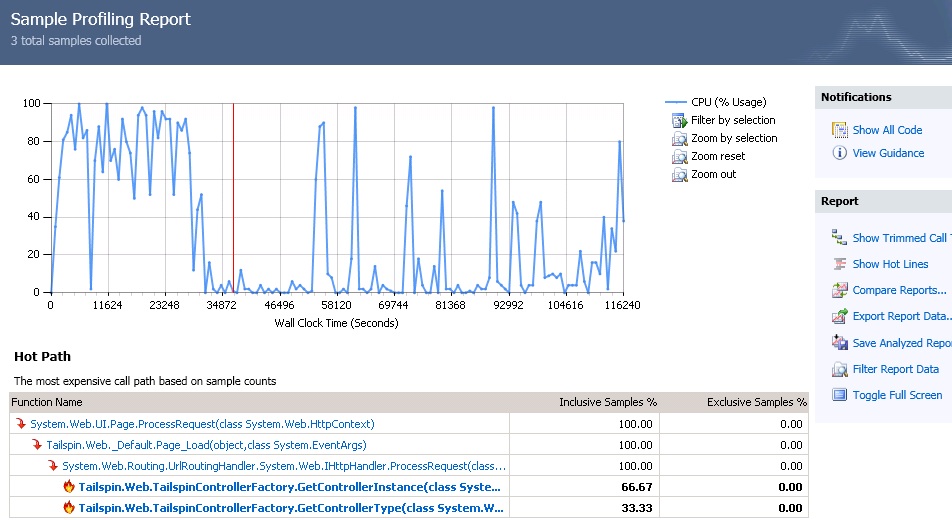
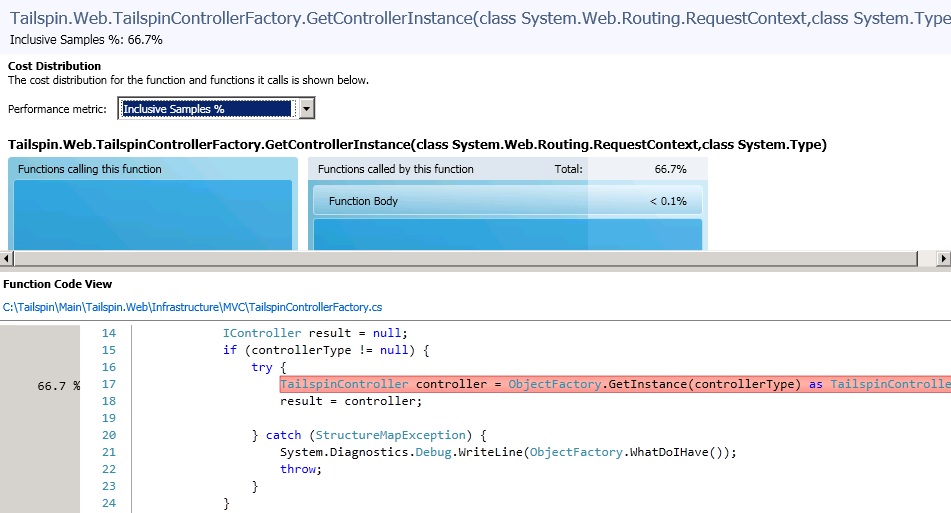
For the purposes of this discussion the profile chosen was “CPU Sampling” which after being rendered shows time, hot path’s (most expensive call paths) and functions doing the most work. Starting with time, you can filter to the point of the highest CPU utilization, thereby narrowing down the scope of your investigation. From there the exact hot paths will be shown and by clicking on a specific one will display the associated code and function performance details.
The following is a list of all the analysis views when conducting a CPU sample profile:
1. Summary
2. Call Tree
3. Modules
4. Caller/Callee
5. Functions
6. Lines
7. Tier Interactions
8. Marks
9. Processes
10. Function Details
11. IPs
Related Views - Caller/Callee
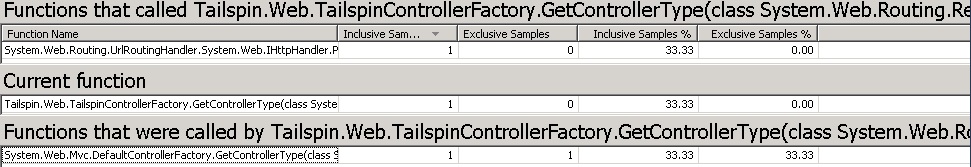
Knowing which functions are being called or are making the calls to other functions is a huge benefit as it allows one to pinpoint the exact code that may be causing an issue. Using this view shows exactly that – functions that called function X, function X itself and functions being called by function X.
Related Views - Tier Interactions
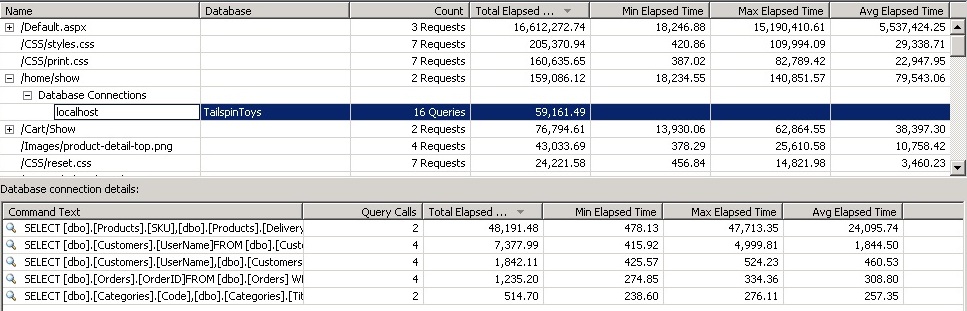
One of the most difficult tasks to accomplish is to diagnose where a bottleneck may be occurring when requesting data from the database. This view, in my humble opinion is one of the most valuable as it enables the ability to not only understand how much time was spent running a query but also how many times said query was executed as well as see the query itself (e.g. “SELECT [dbo].[Customers].[UserName] FROM [dbo].[Customers] WHERE UserName = @p0”).
Summary
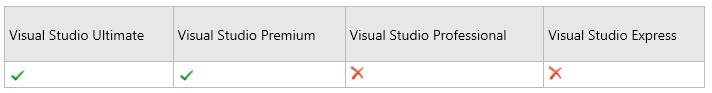
By using performance analysis tools, poorly performing applications will be a thing of the past. Saving and comparing multiple reports offers metrics into whatever changes that were implemented improved performance as opposed to decreasing it (hopefully the former and not the latter). Bundling these tools within the integrated development environment (IDE), Visual Studio has brought performance tuning out of the hands of the few and into the many. The one caveat to this is that you will need one of the following editions installed to take full advantage of this feature: