Monitoring the Performance of Multi-Tiered Windows Azure Applications
AppDynamics is a application performance management solution that helps solve some of biggest challenges with distributed or multi-tier applications - application monitoring, troubleshooting, and performance analysis. Having spent a fair bit of time as a field engineer with Microsoft, I am well aware of some of these challenges. Oftentimes you get to a customer site and it ends up being a missing index of the database which has been slowing everything down. Other times you might notice that challenges within the network are slowing entire suites of applications. In other cases, a simple code change can introduce a severe performance problem and finding the source can be a daunting challenge when the application is distributed and don't know the first place to start.
Cloud apps on Windows Azure are usually Multi-Tiered Apps
Windows Azure makes it easy to write cloud hosted applications. By design, these applications tend to be highly distributed with multiple tiers. Troubleshooting poor performance means knowing exactly which node or tier is failing. Distributed applications do not have a single point of failure. Everything here and every single node on every tier suspect - from the operating system, to middleware, to third-party products, hardware, network configuration, and your own software logic. Each node typically performs its own I/O, has its own ethernet cards, and contains various running processes and threads.
As the complexities of applications grows, trying to find the slow pieces becomes increasingly more difficult. It involves much more than just looking at log files for the OS or for the web server. Logging is only useful if engineers had the forethought to log the error condition.
Cloud computing typically adds a layer of abstraction to your applications. For starters, you don’t have physical access the hardware. This limits you from having to physical interaction that specific pieces of the architecture. It also limits your conceptual understanding of all the moving pieces - you will need to create the diagram yourself. Many cloud-based applications leverage third-party services, such as identity or caching. These pieces often get overlooked when troubleshooting, because they’re not a big part of an application’s code base.
Application Performance Monitoring (APM) step up to solve the problem by looking at the inner workings of your cloud based applications. These tools can see the code executing, the entry and exit calls to the application, the transactions flowing through and across multiple application components.
High Level Perspective is needed
What is really needed is a visual overview of the entire application. An application flow map allows you to understand all of the dependencies of a distributed application. The ability to drill down into connection points an individual nodes is critical. Oftentimes there are customers that are being affected, so speedy resolution is crucial. Having a bird’s eye view of all the moving pieces is what leads to efficient troubleshooting and faster resolution of production problems.
Anticipating problems
A better approach is to actually anticipate problems before they occur. That is, the goal should be moved more of a pro-active monitoring approach, as opposed to a reactive approach. This means finding and fixing performance problems immediately before they become critical. A great place to start is building an application flow map, which shows all the pieces in the application and how the data travels among those pieces. It also means building a baseline of expected performance given specific load thresholds, and then monitoring the performance over time. This includes measuring browser response time, which is ultimately the way your customers will evaluate the performance of your cloud-based application. If performance objectives are not met, it is important for network administrators, developers, and business stakeholders to get some numbers and facts early on and head off any future problems. AppsDynamics can set alerts whenever baseline conditions have deviated.
An Example - 3 Tiers (Web Front End, Service Bus, Background Process/Worker Role)
So what I did to get started was walk through one of the Azure labs. The lab that I wanted test was this one:
The lab demonstrates Queues, Pub/Sub
The purpose of the lab is to set up a multitier application that leverages Windows Azure service bus queues. As most architects know, queues make it possible to architect decoupled applications. Queues are powerful because it allows for client applications to submit messages at a high rate of speed, one that may exceed the ability of the backend server to process. As the queue size begins to grow, more Windows Azure worker roles can be added to increase scale and therefore process messages in a timely fashion. This is also a core building block for publish subscribe patterns.
3 Tier Diagram
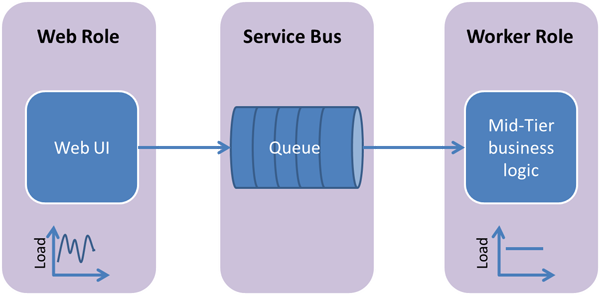
The way figure 1 works is simple. Client applications connect to the web role and send messages. The web role takes these messages and then places them into the queue, which run as a Windows Azure Service Bus application. The worker role can be thought of as a background process. It checks the queue in the service bus and reads messages from the queue. If the queue starts getting too large, then we need to scale the worker roles to be able to handle the volume of messages that are getting placed into the service bus queue.
Note: The Web Role can act as both a proxy for other apps. It also includes a web page front end. This means that the web role is really 2 tiers in this example.
Figure 1 - Conceptual Diagram of Multi-Tiered Application
Where is the bottleneck?
The diagram above you can notice that the web role can act as a proxy to client applications that wish to submit a message to the worker roles. However, if this application starts to perform badly, troubleshooting can be a challenge. Identifying the performance bottleneck can be tricky. For example it might be happening as the web role submits messages to the service bus. Or it could be that the worker role cannot read quickly enough from the service bus due to the throughput and size of the message is getting submitted. Moreover, imagine that a database is involved, further obscuring the exact source of errant application behavior.
The ideal world
In the ideal world a developer would be able to publish their application into the cloud and be able to see each of these tears as a node in a diagram that a web portal. Well, that’s exactly what AppDynamics lets you do.
AppDynamics automatically provides a useful diagram
Notice that the view provided by AppDynamics (Figure 2) is almost identical to the conceptual diagram. The beauty of all this it is that it is done automatically by AppDynamics when you publish your application. As her application grows or scales, AppDynamics will maintain the diagram for you. AppDynamics will also allow you to automatically capture benchmarks to be used for future diagnostics.
The view in Figure 2 is what can be seen at the AppDynamics portal. This is not a diagram that a developer or architect constructed. This is a diagram built automatically by AppDynamics using the agents and framework elements that are part of AppDynamics. When you deploy an Azure Project, this MSI executes: dotNetAgentSetup64.msi.
Figure 2 - AppDynamics View - Automatically Generated
Looking at some code
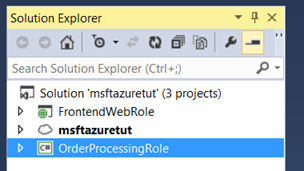
Here is the solution in Visual Studio 2013. Notice that the solution closely mirrors Figures 1 and 2. That is the ideal scenario - the developer can think conceptually from the concept to the performance monitoring to the Visual Studio project layout.
Figure 3 - Visual Studio Project
Understanding the code
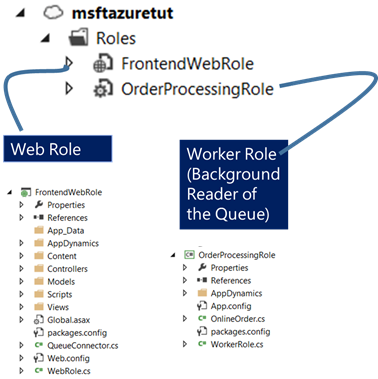
In the total solution there are three projects. Msftazuretut is the main project in the solution and is used for deployment and overall configuration. As explained previously, the web role is used in 2 ways. The first way is that it acts as the client app, submitting messages into the queue. The second way is that it can act as a front-end to other client applications. After all, it is an MVC Web API style application. The third piece is the worker role, which is essentially a background process, reading from the queue, processing messages asynchronously that are waiting in the queue, placed there by the web role.
Figure 4 - Visual Studio 2013 Solution
More detailed logic
The logic here is pretty straightforward.
Web Role Code - Controller
| HomeController.cs | |
| 1 2 3 4 5 6 7 8 9 10 11 12 13 14 15 16 17 18 19 20 21 22 23 24 25 26 27 28 29 30 31 32 33 34 35 36 37 38 39 40 41 42 43 44 45 46 47 48 49 50 51 52 53 54 55 56 57 58 59 60 61 62 63 64 65 66 67 68 69 70 71 72 73 | using System; using System.Collections.Generic; using System.Linq; using System.Web; using System.Web.Mvc; using FrontendWebRole.Models; using Microsoft.ServiceBus.Messaging; using Microsoft.ServiceBus; namespace FrontendWebRole.Controllers { // The controller for the web role. // It has 2 capabilities. First, it presents an entry // form for an order (Customer and Product Numbers) // Once the form is submitted, the second capability // comes into play - to place the submitted order as // a message into a service bus queue. public class HomeController : Controller { public ActionResult Index() { // Simply redirect to Submit, since Submit will serve as the // front page of this application return RedirectToAction("Submit"); } public ActionResult About() { return View(); } // GET: /Home/Submit public ActionResult Submit() { // Connect to the service bus queue var namespaceManager = QueueConnector.CreateNamespaceManager(); // Get the queue, and obtain the message count. var queue = namespaceManager.GetQueue(QueueConnector.QueueName); ViewBag.MessageCount = queue.MessageCount; return View(); } // POST: /Home/Submit // Controler method for handling submissions from the submission // form. [HttpPost] // Attribute to help prevent cross-site scripting attacks and // cross-site request forgery. [ValidateAntiForgeryToken] public ActionResult Submit(OnlineOrder order) { if (ModelState.IsValid) { // Create a message based on the order submitted by the form. // This will include a customer number and a product number. var message = new BrokeredMessage(order); // Submit the order. This adds the order to the // service bus queue. QueueConnector.OrdersQueueClient.Send(message); return RedirectToAction("Submit"); } else { return View(order); } } } } |
Figure 5 - The Web Role
Worker Role Code
| WorkerRole.cs | |
| 1 2 3 4 5 6 7 8 9 10 11 12 13 14 15 16 17 18 19 20 21 22 23 24 25 26 27 28 29 30 31 32 33 34 35 36 37 38 39 40 41 42 43 44 45 46 47 48 49 50 51 52 53 54 55 56 57 58 59 60 61 62 63 64 65 66 67 68 69 70 71 72 73 74 75 76 77 78 79 80 81 82 83 84 85 86 87 88 89 90 91 92 93 94 95 96 97 98 99 | using System; using System.Collections.Generic; using System.Diagnostics; using System.Linq; using System.Net; using System.Threading; using Microsoft.ServiceBus; using Microsoft.ServiceBus.Messaging; using Microsoft.WindowsAzure; using Microsoft.WindowsAzure.ServiceRuntime; using FrontendWebRole.Models; namespace OrderProcessingRole { // Worker role is responsible for reading message // put into the service bus queue by the web role. public class WorkerRole : RoleEntryPoint { // The name of the queue. It is the same queue used // by the web role. const string QueueName = "OrdersQueue"; bool onStopCalled = false; // The Client is an object used to read from the // service bus queue. QueueClient Client; // The Run() method can be thought of as a never ending background // process that reads messages from the service bus queue. public override void Run() { Trace.WriteLine("Starting processing of messages"); // Loop forever until onStopCalled is set. while (true) { try { // If OnStop has been called, return to do a graceful shutdown. if (onStopCalled == true) { System.Diagnostics.Debug.WriteLine("onStopCalled WorkerRole"); return; } // Read the messsage (if exists) from the service bus queue. BrokeredMessage receivedMessage = Client.Receive(); // Process the message System.Diagnostics.Debug.WriteLine("Processing Service Bus message: " + receivedMessage.SequenceNumber.ToString()); // Load the message into the OnlineOrder object. OnlineOrder order = receivedMessage.GetBody<OnlineOrder>(); // For debugging purposes, display the order sent in by the web role. Debug.WriteLine(order.Customer + ": " + order.Product, "ProcessingMessage"); receivedMessage.Complete(); } catch { // Handle any message processing specific exceptions here } } //CompletedEvent.WaitOne(); } public override bool OnStart() { // Set the maximum number of concurrent connections ServicePointManager.DefaultConnectionLimit = 12; // Get the connection string to setup the connection. string connectionString = CloudConfigurationManager.GetSetting("Microsoft.ServiceBus.ConnectionString"); var namespaceManager = NamespaceManager.CreateFromConnectionString(connectionString); // Create queue, if doesn't exist. if (!namespaceManager.QueueExists(QueueName)) { namespaceManager.CreateQueue(QueueName); } // Create a client object to be used by Run() method to // read messges. Client = QueueClient.CreateFromConnectionString(connectionString, QueueName); return base.OnStart(); } public override void OnStop() { // Cleanup and close. Client.Close(); onStopCalled = true; base.OnStop(); } } } |
Figure 6 - The Worker Role
6 Steps to Simple Performance Monitoring
Once you complete the Azure tutorial, you can prepare the solution to leverage the application performance monitoring.
There are just 6 simple steps. They are fully documented here:
| Step 1 | Register for an AppDynamics Account. |
| Step 2 | Download the .NET Agent for AppDynamics. |
| Step 3 | Add the agent to a web role or worker role. You must add the agent to each web and worker role. |
| Step 4 | Add some startup commands in the form of a startup.cmd text file. This means copying some boilerplate code into startup.cmd. It also means going into the ServiceDefinition.csdef file and indicating that the startup.cmd file you just added gets executed on startup. |
| Step 5 | Publish your application. |
| Step 6 | Monitor performance. Use your browser to visit the AppDynamics Controller at the URL given in your welcome email and on your AppDynamics account home page. |
Conclusion
Multi-tiered applications are notoriously difficult to troubleshoot, especially when hosted in cloud infrastructures. When there is an outage or when performance slows, it is difficult to identify the root cause or location of the issue. Even more difficult is to anticipate problems before they dramatically affect end users. Setting up alerts and monitoring agents needs to be simple and fast. Moreover, as application complexity grows, it is important for the system to dynamically discover application tiers and map the transaction flow, focusing on real-time request latency, payload inspection, response times, error rates, and transactional grouping. In short, AppDynamics provides holistic, multi-dimensional view at the business transaction level as well as the lower level infrastructure component performance. It makes it quick and easy to find slow transactions, memory leaks, slow database queries, thread contention and more.


