High Level Guidance on Troubleshooting, Diagnosing, and Fixing Errors for Developers (in the cloud and on-premises)
What all developers should know about finding and fixing problems.
- I was a Field Engineer for several years. I spent my time finding and fixing problems.
- I thought we could learn a little more what you should know.
- What amount of downtime can you tolerate?
- Downtime is often expressed as the nines
- Maybe we can explore some options and discuss some things to consider
Basic Concerns for developers
- Detecting Errors - What is the source of the error?
- Reported by User
- Error Log Files
- Performance Problem
- The art of Identifying Root Cause
- What isn't working and why
- Is it repeatable?
- Could be a nightmare if it isn't
- Fixing the error
- How will error be resolved?
- More disk space, thread contention, etc
- How will error be resolved?
- Verifying Resolution
- Is error repeatable and testable?
- Deployment
- Do you have a test environment?
- Will there be service disruption
Things to check when deploying
- Think about those things that vary between production and development
- Focus on those things for stability and uptime.
- Database connection
- Website connection
- Configuration file
- Registry key
- Other things to check where failures happen
- Database access
- External web site/service access
- ACLs
- Transactions
- Configuration
- Capacity
- Network
- Examples of failures
- Configuration file is not in correct location
- Too much traffic overusing resources
- Database reaches maximum capacity
- Typical Database Failures
- Server not responding
- Database offline
- Check for running services
- Access denied
- Sproc execute denied
- Object doesn't exist
- Timeout on connect
- Index corrupt
- Database corrupt
- Table doesn't exist
- Table corrupt
- Config file missing or invalid
Start with Emulators, leverage logs in production
- Using Visual Studio, you can debug applications in your local machine by stepping through code, setting breakpoints, and examining the value of program variables.
- When you install the Azure tooling, you are provided a compute emulator which allows you to run the code locally.
- You can do a lot of debugging before deploying to the cloud.
- This is the first most productive way to do things.
- But once you deploy, this compute emulator is not useful.
- Instead, you will need to rely on debugging information written to logs in order to diagnose and troubleshoot application failures
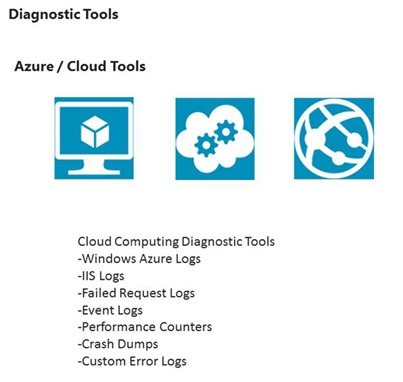
- Windows Azure provides many opportunities to collect diagnostics in the form of:
- Logs, IIS logs, failed request traces, Windows event logs, custom error logs, and crash dumps
For information, you can do the lab in the Windows Azure Platform Training Kit
- C:\WATK\Labs\DebuggingCloudServices\HOL.htm
Connection Problems occur connecting to these services
- SQL Database/Azure
- https://msdn.microsoft.com/en-us/library/windowsazure/ff394106.aspx
- General Errors
- Database Copy Errors
- Connection-Loss Errors
- Federation Errors
- https://convective.wordpress.com/2011/09/28/handling-transient-connection-failures-in-sql-azure/
- https://msdn.microsoft.com/en-us/library/windowsazure/ff394106.aspx
- Azure Cache
- Azure Service Bus
- Troubleshooting Connectivity Issues in the Windows Azure AppFabric Service Bus
- Things to consider:
- Dealing with Faulted Messaging Objects
- Handling Transient Communication Errors
- If your network is locked down, work with your network administrator to ensure that TCP ports 9350-9355 and/or http ports 80/443 ports are open for outbound traffic
- If you are using the ISA Server (ISA) or Forefront Threat Management Gateway (TMG), make sure that the associated client software (ISA Server Firewall Client / TMG Client Agent) is running on the computer.
- Note: Stopping and restarting the services associated with the client software has helped with connectivity issues in certain instances.
- Ensure that the application is running under a domain joined account.
- Some proxies are configured to authenticate all egress traffic against domain-joined accounts.
- Non domain accounts may also be unable to resolve addresses to their corresponding IP.
- Azure Storage
- Overview of Windows Azure Diagnostics
- https://msdn.microsoft.com/en-us/library/windowsazure/hh411552.aspx
- Important considerations when implementing Windows Azure Diagnostics
- Setting up Windows Azure Diagnostics
- Tracing the flow of your Windows Azure application
- Creating and Using Performance Counters in a Windows Azure Application
- Storing and viewing diagnostic data in Windows Azure storage
- Managing the configuration of Windows Azure Diagnostics
- Getting started with implementing Windows Azure Diagnostics
- Important considerations when implementing Windows Azure Diagnostics
- https://msdn.microsoft.com/en-us/library/windowsazure/hh411552.aspx
- Overview of Windows Azure Diagnostics
Scale can improve robustness
- Improving Reliability through scale
- Choose more instances at the smallest size possible
- Note the table above when choose a Web Role or Worker Role (Azure Cloud Service - PaaS)
- Many Extra Smalls are better than one Extra Large
- But this may result in more upgrade domains, which could mean longer upgrade times
- Use a Separate storage account for diagnostics
- Enable Remote Desktop (always help to remote in, if possible)
- Azure SCOM management pack
- The Monitoring Pack for Windows Azure Applications enables you to monitor the availability and performance of applications that are running on Windows Azure.
- The monitoring pack runs on a specified agent and then uses various Windows Azure APIs to remotely discover and collect instrumentation information about a specified Windows Azure application.
- Choose more instances at the smallest size possible
- Azure SCOM discovers Windows Azure applications.
- Provides status of each role instance.
- Collects and monitors performance information.
- Collects and monitors Windows events.
- Collects and monitors the .NET Framework trace messages from each role instance.
- Grooms performance, event, and the .NET Framework trace data from Windows Azure storage account.
- Changes the number of role instances.
Common Http Errors
- HTTP error message-The webpage cannot be found (HTTP 400)
- What it means
- Your browser is able to connect to the web server, but the webpage cannot be found because of a problem with the web address (URL). This error message often happens because the website address is typed incorrectly.
- What you can do
- Make sure the address is correct and try again.
- What it means
- HTTP error message-The website declined to show this webpage (HTTP 403)
- What it means
- Your browser is able to connect to the website, but Your browser does not have permission to display the webpage. This can happen for a variety of reasons; here are some of the most common:
- The website's administrator has to give you permission to view the page or the web server does not accept public webpage requests. If this is a website that you should have access to, contact the website administrator.
- The webpage you're trying to view is generated by a program, such as a shopping cart or search engine, and the folder on the server the program is contained in is not correctly configured by the website administrator.
- You have typed a basic web address (for example, www.example.com), but the website does not have a default webpage (such as index.htm or default.html). Additionally, the website does not allow directory listing, which allows you to view files in a web folder.
- Your browser is able to connect to the website, but Your browser does not have permission to display the webpage. This can happen for a variety of reasons; here are some of the most common:
- What you can do
- Check to be sure you have a correct address. If it's a link, it could be out of date and no longer available on the website.
- What it means
- HTTP error message-The webpage cannot be found (HTTP 404)
- What it means
- Your browser is able to connect to the website, but the webpage is not found. This error is sometimes caused because the webpage is temporarily unavailable or because the webpage has been deleted.
- What you can do
- Try again later. Check to be sure you have a correct address and it is spelled correctly. If it's a link, it could be out of date and no longer available on the website.
- What it means
- HTTP error message-The website cannot display the page (HTTP 405)
- What it means
- Your browser is able to connect to the website, but the webpage content cannot be downloaded to your computer. This is usually caused by a problem in the way the webpage was programmed.
- What you can do
- Unfortunately, this is a problem with the website, and there isn't much you can do unless you're the webmaster. You could try again later to see if the problem has been corrected. If it's a site you go to often without problems, you might try contacting the website owner.
- What it means
- HTTP error message-Your browser cannot read this webpage format (HTTP 406)
- What it means
- Your browser is able to receive information from the website but it is in a format that Your browser does not know how to display.
- What you can do
- If you are requesting a document, check to see if you are including the file extension, such as .pdf or .doc.
- What it means
- HTTP error message-The website is too busy to show the webpage (HTTP 408 or 409)
- What it means
- The server took too long to display the webpage or there were too many people requesting the same page.
- What you can do
- Try the webpage again later. Increase timeouts on the server.
- What it means
- HTTP error message-That webpage no longer exists (HTTP 410)
- What it means
- Your browser is able to connect to the website, but the webpage cannot not be found. Unlike HTTP error 404, this error is permanent and was turned on by the website administrator. It is sometimes used for limited time offers or promotional information.
- What you can do
- Check to be sure you have a correct address. If it's a link, it could be out of date.
- What it means
- HTTP error message-The website cannot display the page (HTTP 500)
- What it means
- The website you are visiting had a server problem that prevented the webpage from displaying. It often occurs as a result of website maintenance or because of a programming error on interactive websites that use scripting.
- What you can do
- Unfortunately, this is a problem with the website, and there isn't much you can do unless you're the webmaster. You could try again later to see if the problem has been corrected. If it continues, and it's a site you go to often without problems, you might try contacting the website owner.
- What it means
- HTTP error message-The website is unable to display the webpage (HTTP 501 or 505)
- What it means
- Error 501 (HTTP 501 - Not Implemented) means that the website you're visiting is not set up to display the content your browser is requesting.
- Error 505 (HTTP 505 - Version Not Supported) means the website does not support the version of the HTTP protocol your browser uses (HTTP/1.1 being the most common) to request the webpage.
- What you can do
- These errors might occur if you have HTTP 1.1 enabled. To disable HTTP 1.1, click the Tools button, click Internet Options, and then click the Advanced tab. Under Settings, scroll down to the HTTP 1.1 settings section, and then clear the check boxes for Use HTTP 1.1. These errors might also occur if a third-party product is interfering with Internet Explorer. Try closing all programs and then attempt to access the webpage again.
- What it means
Debug Tooling for developers
- Netmon
- https://www.microsoft.com/en-us/download/details.aspx?id=4865
- Network Monitor is a protocol analyzer.
- It allows you to capture network traffic and view and analyze it.
- Blog for NetMon
- WinDBG
- Multipurposed debugger for Microsoft Windows
- Debug Managed or Native Applications
- It can be used to debug user mode applications, drivers, and the operating system itself in kernel mode
- Allows to spot locked threads, stack traces, set breakpoints, view memory
- A lower level debugger than visual studio
- View assembly, C, C#, etc
- It is a GUI application, but has little in common with the more well-known Visual Studio Debugger
- But Visual Studio has its strengths!
- DebugDiag
- The Debug Diagnostic Tool (DebugDiag) is designed to assist in troubleshooting issues such as hangs, slow performance, memory leaks or fragmentation, and crashes in any user-mode process
- The tool includes additional debugging scripts focused on Internet Information Services (IIS) applications, web data access components, COM+ and related Microsoft technologies
- Download link: https://www.microsoft.com/en-us/download/details.aspx?id=26798
- Fiddler
- Fiddler is a Web Debugging Proxy which logs all HTTP(S) traffic between your computer and the Internet
- Fiddler allows you to inspect traffic, set breakpoints, and fiddle with incoming or outgoing data
- Fiddler includes a powerful event-based scripting subsystem, and can be extended using any .NET language
- Fiddler is freeware and can debug traffic from virtually any application that supports a proxy, including Internet Explorer, Google Chrome, Apple Safari, Mozilla Firefox, Opera, and thousands more
- You can also debug traffic from popular devices like Windows Phone, iPod/iPad, and others
- SysInternals
- Assists in optimizing files, disks, processes, security features, networking, maintenance, and other essential operation
- Includes
- Process Explorer
- Process Monitor
- Autoruns
- PsTools
- Process and Diagnostic Utilities
- Security Utilities
- Active Directory Utilities
- Desktop Utilities
- File Utilities
- Disk Utilities
- Network and Communication Utilities
- System Information Utilities
- Miscellaneous Utilities
- tracert/netstat
- tracert is diagnostic tool for displaying the route (path) and measuring transit delays of packets across an Internet Protocol (IP) network
- netstat displays network connections (both incoming and outgoing), routing tables, and a number of network interface (network interface controller or software-defined network interface) and network protocol statistics.
- It is available on Unix, Unix-like, and Windows NT-based operating systems.
Power of Redundancy - Some techniques people use to be as redundant as possible
- Within a Datacenter
- Windows Azure handles this as long as you keep instance count to 2 or above. Data is automatically replicated 3 times (tables, blobs, queues, SQL Database)
- Traffic Management
- https://blogs.msdn.com/b/brunoterkaly/archive/2012/04/26/networking-in-the-cloud-understanding-windows-azure-traffic-manager.aspx
- You may have Azure instances of your application in multiple data centers throughout the world and you want to manage traffic among all your running instances--Traffic Manager works by applying an intelligent policy engine to the Domain Name Service (DNS) queries on your domain name(s).
- Across Cloud Providers
- Use multiple cloud providers and have a failover strategy
- Across On Premise and Cloud
- Use on premises resources to plan for failure and visa versa
- Across Data Centers
- Leverage Azure's geo-replication
Follow Up
- Download this document for some great ideas and additional techniques.


