Ask Learn
Preview
Ask Learn is an AI assistant that can answer questions, clarify concepts, and define terms using trusted Microsoft documentation.
Please sign in to use Ask Learn.
Sign inThis browser is no longer supported.
Upgrade to Microsoft Edge to take advantage of the latest features, security updates, and technical support.
Note
Access to this page requires authorization. You can try signing in or changing directories.
Access to this page requires authorization. You can try changing directories.
Anyone that has talked to me recently about how I write PowerShell scripts will know that Visual Studio Code is my new one and only! You can write PowerShell scripts in there and hit F5 to have a similar debugging experience to what you would get in PowerShell ISE - but did you know that you can extend that to make it easier to debug and test different scenarios from within VS Code? If the answer to that is no, then read on!
VS Code has a number of files that it will look for when you open a directory that it will use to customise the way it behaves, launch.json is one of these. If you place this file at "/.vscode/launch.json" within a directory that you are working with, you'll be able to create customised ways to launch the debugger for your project. This applies to any language that VS Code supports debugging for, not just PowerShell - but let me show you what I'm talking about in some detail.
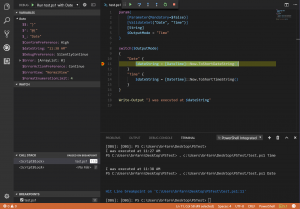
First lets talk about what happens when you debug a PowerShell script in VS Code without a launch.json file in place.
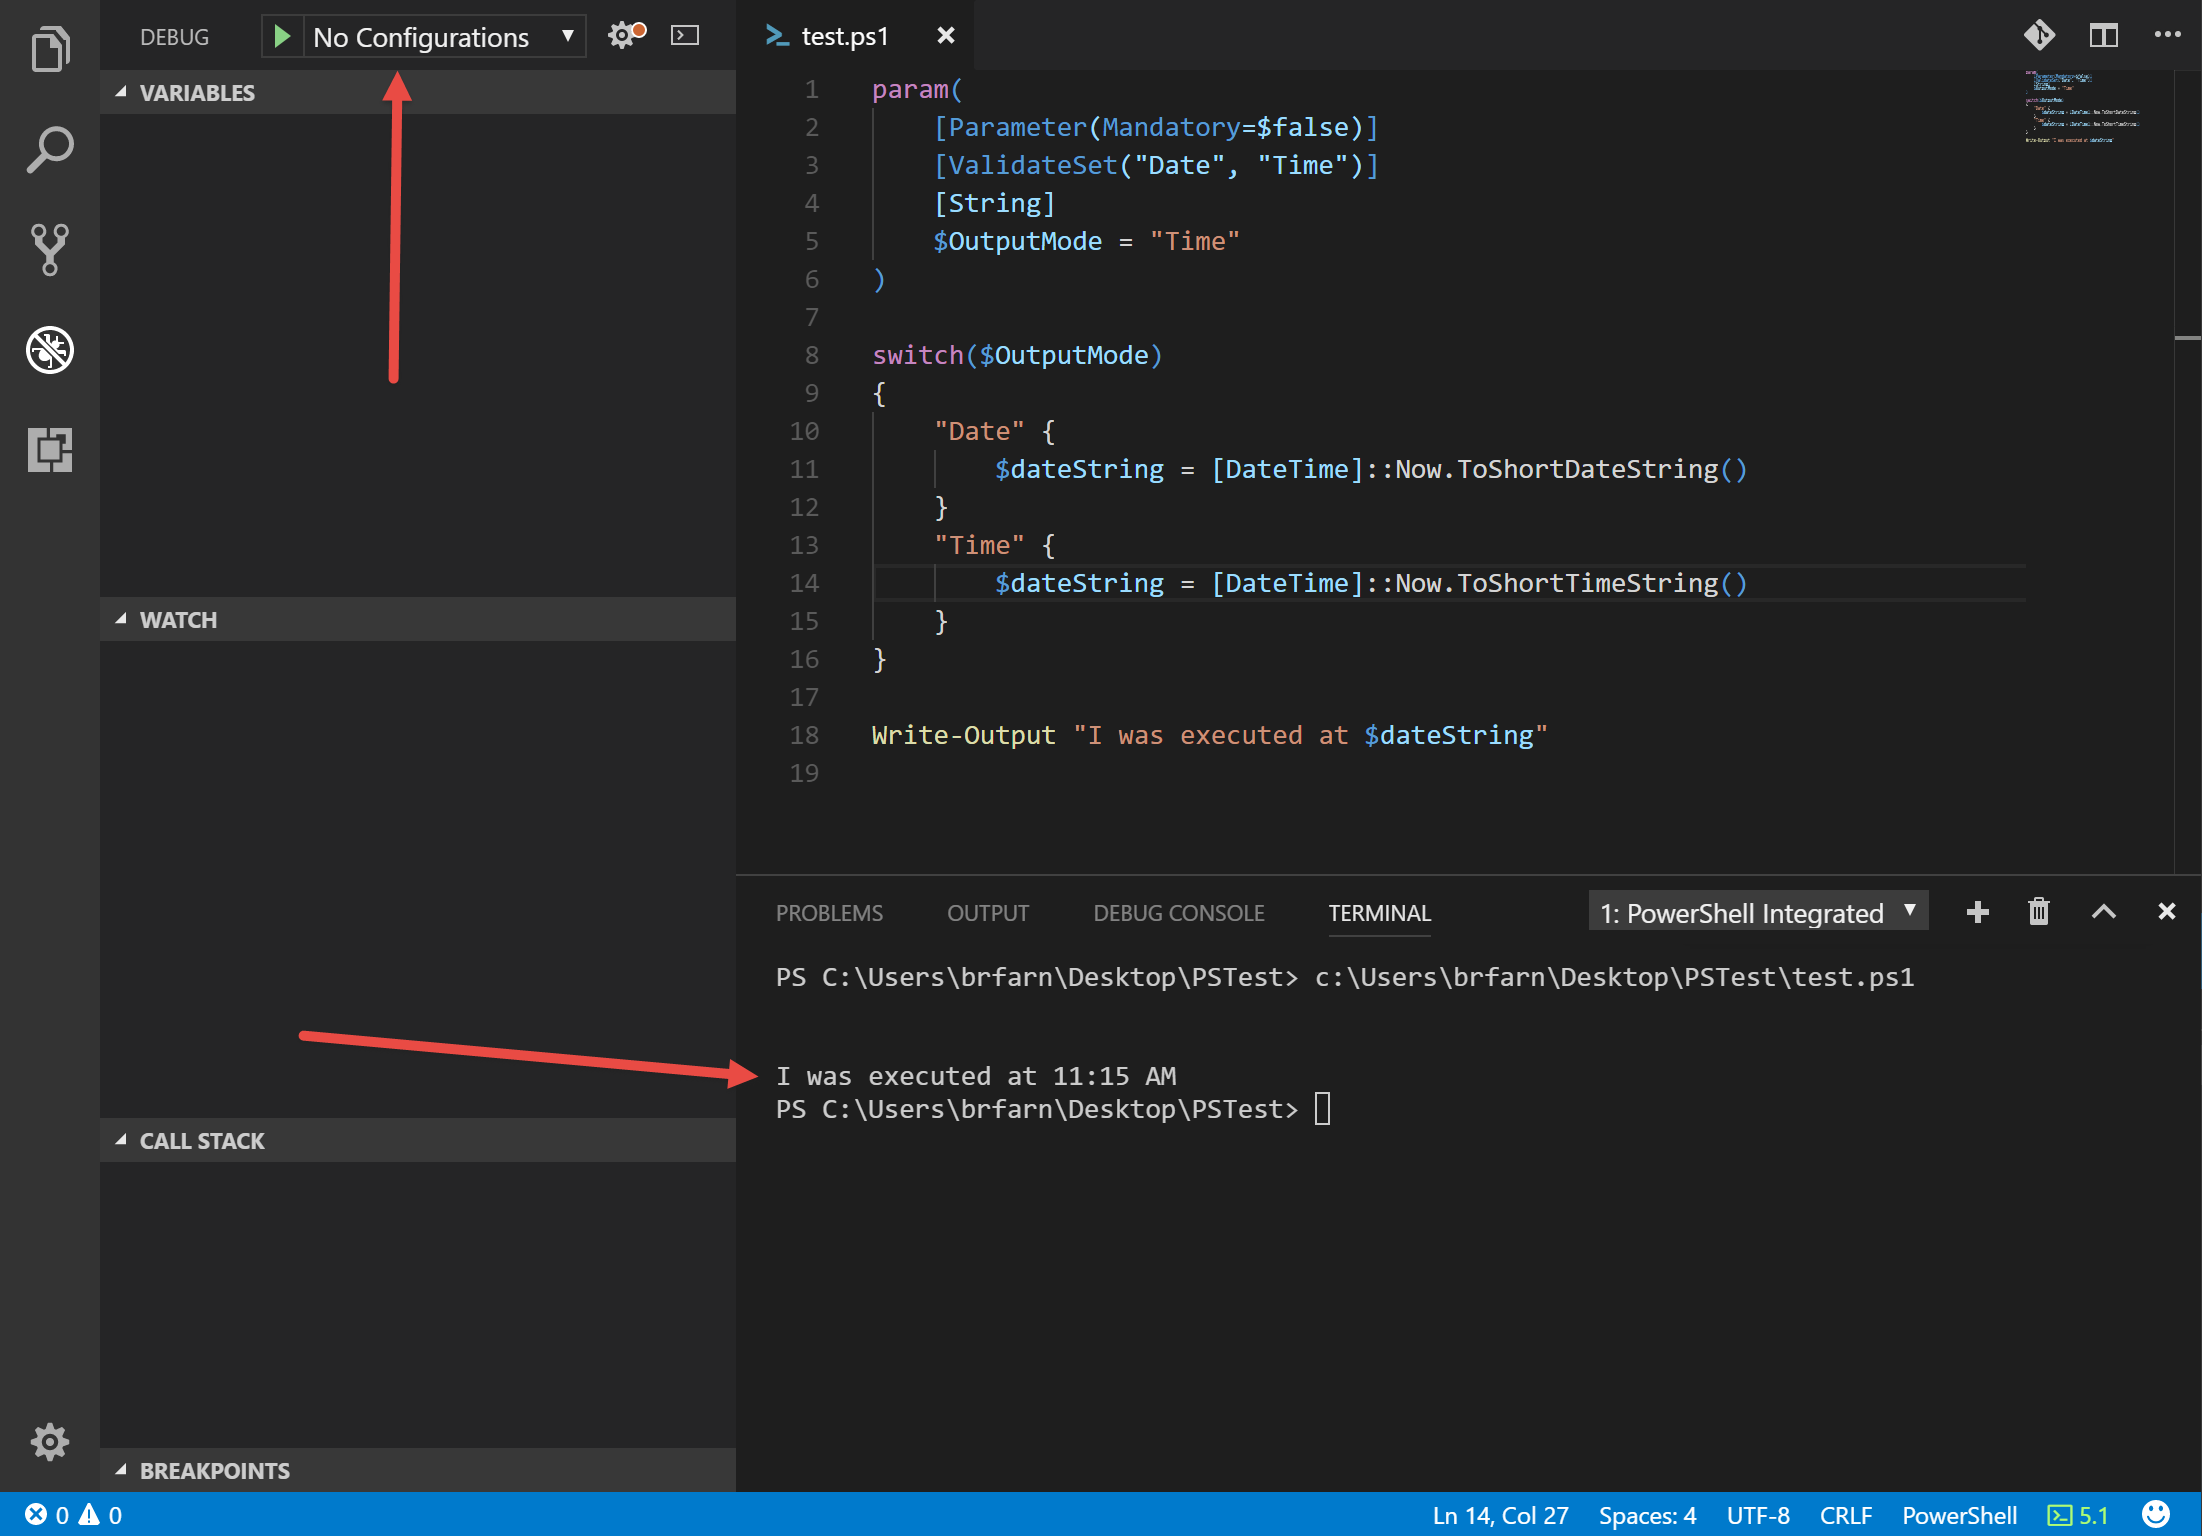
In this screen shot you can see a few things. Firstly note that in the debug tab I see "No Configurations" - this is what happens when there is no launch.json file (or when you have one that has an empty configurations element in it). But you can see I can still press F5 (or use the little green arrow icon in the debug tab) to run my script and VS Code will launch the current PowerShell file and attach the debugger to it using the integrated PowerShell host.
The last thing you'll notice is that next to the "No Configurations" drop down that you see a cog shaped icon with a red dot over it - this is an indicator that you don't have a launch.json file or that there is some sort of issue with it. If you click on this you'll actually see that VS code will create a launch.json file for you with a couple of default configurations (which will be based on PowerShell because we have a PowerShell file open in our directory)
When you add the default launch.json file to a folder with PowerShell files you'll see the following new "Configurations" that appear in the drop down that previously said "No configurations"

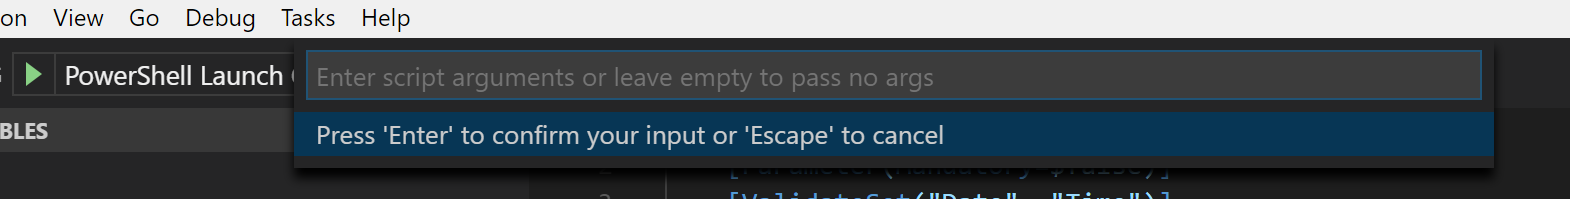
Now these are all fairly common scenarios for when you want to debug a PowerShell script, here are some of the times you might use each of them:
So you can see that with the default launch.json file you gain quite a lot of flexibility beyond the old 'F5' experience. But we can take things further than this.
Now lets assume that you want to debug your scripts in a way that doesn't line up with one of those default options, you can actually configure the launch.json file to have custom configurations that you create yourself. In this example, I'm going to work with a basic script file called "test.ps1" which looks like this:
 param(
 [Parameter(Mandatory=$false)]
 [ValidateSet("Date", "Time")]
 [String]
 $OutputMode = "Time"
)
switch($OutputMode)
{
 "Date" {
 $dateString = [DateTime]::Now.ToShortDateString()
 }
 "Time" {
 $dateString = [DateTime]::Now.ToShortTimeString()
 }
}
Write-Output "I was executed at $dateString"
Basically all the script does is to output either the current date or the current time, based on a parameter that is optionally passed in to the file itself. Now if you want to add a new configuration you can open the launch.json file up and use the "Add configuration" button, which will then let you select from a range of "stubs" that you can choose for your configuration as a starting point.
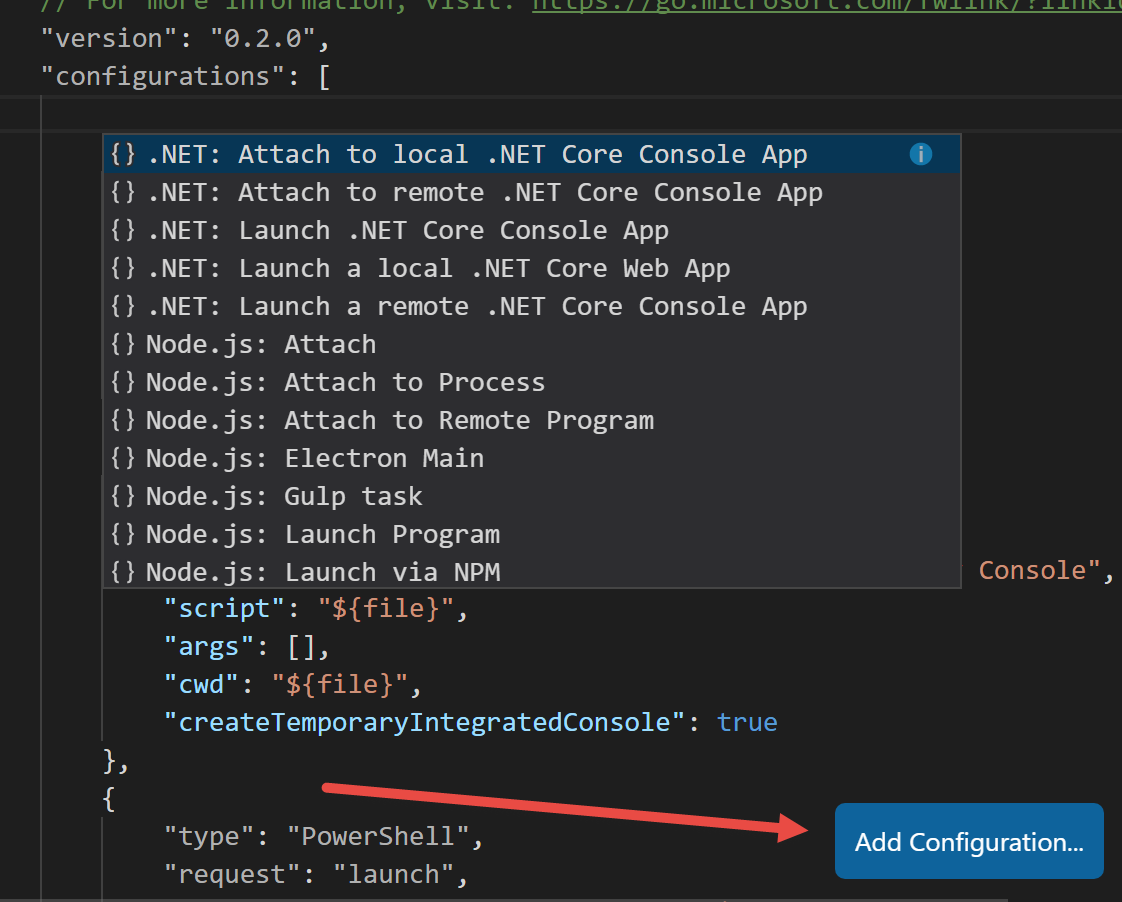
Here there are some PowerShell options in the list that look similar to the defaults. For my example I'm going to choose to add the "launch script" activity - here I can tell VS Code to run a specific script file (no matter what is open in the current window) and I can optionally add arguments to this call as well. I'll add two activities here so I can call test.ps1 with each of the argument options from the debugger there, one for "Date" and the other for "Time". The two new activities in launch.json look like this:
  {
 "type": "PowerShell",
 "request": "launch",
 "name": "Run test.ps1 with Date",
 "script": "${workspaceRoot}/test.ps1",
 "args": ["Date"],
 "cwd": "${workspaceRoot}"
 },
 {
 "type": "PowerShell",
 "request": "launch",
 "name": "Run test.ps1 with Time",
 "script": "${workspaceRoot}/test.ps1",
 "args": ["Time"],
 "cwd": "${workspaceRoot}"
 }
Now as soon as I have added these to launch.json I see that they appear in my configurations drop down...
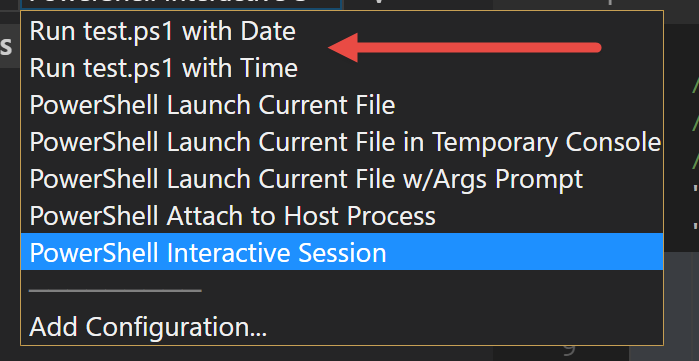
... and when I select each one, I see my test script will run with the debugger attached but with the appropriate arguments passed
This is a pretty simple example of how you can customise the launch.json file - I'm sure next time you find yourself debugging PowerShell scripts that you can find some ways to use this. Another example of how I'm using it is a recent change to the SharePointDsc project - we are adding the option to run the currently open unit test file but to simulate either SharePoint 2013 or 2016 based on which arguments are passed to the test file. Hopefully this is useful for you as well. Happy debugging!
Ask Learn is an AI assistant that can answer questions, clarify concepts, and define terms using trusted Microsoft documentation.
Please sign in to use Ask Learn.
Sign in