OpsMgr SP1 – Creating rules and monitors for multi instance components
When creating a monitor or a rule for a multi instance component you need to be very careful or else you may end up with wrong monitoring logic. The two important parts are:
1. Target the rule/monitor to the correct target type
2. Specify the correct performance object, counter, and instance name.
Here is short list of multi instance components that come to my mind:
1. Logical Disk
2. Physical Disk
3. Network Adapter
4. Web Site
5. Database
6. Processor
7. DB Engine (SQL Server Instance)
The mistake that I have seen people make is when creating a rule or monitor for the above, they would check the “All Instances” check box when selecting the performance counter. This is incorrect and in the case of a performance collection rule will result in much more data being collected then assumed. In the case of a unit monitor this could result in the wrong health state.
The main improvement in SP1 to help create properly configured rules and monitors is having the ability to tell the monitor or rule to use a particular property of the multi instanced component such as the Logical Disk name rather than hard coding it. This is possible in the with the RTM build but only by editing the MP xml or using the authoring console. Given that for each one of the components listed above the syntax is a little bit different I will provide examples for each one:
Logical Disk:
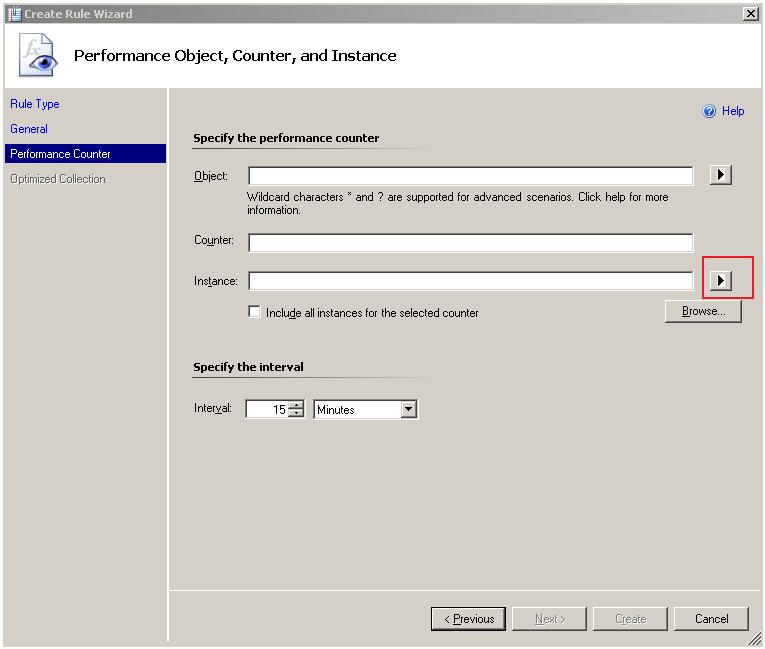
For Logical Disk monitoring you should target your rule/monitor to Logical Disk (Server)/Logical Disk (Client)/Windows Server 2003 Logical Disk. The performance object used for monitoring logical disk is called “Logical Disk”, it offers an instance per installed logical disk. The key thing here is to specify the proper instance name. In order to specify the correct instance name, you should click the button to the left of the instance name edit box in the rule/monitor creation wizard:
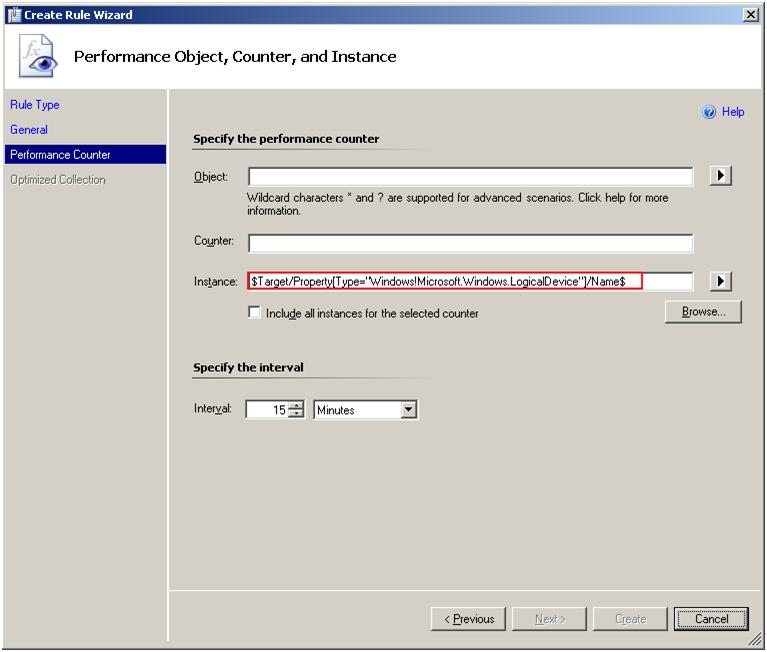
From the popup menu you should select DeviceName. This property will contain the appropriate name of the logical disk and can be used as the performance instance name in the configuration of the rule/monitor.
Physical Disk:
For physical disk monitoring you should target your rule/monitor to Physical Disk (Server)/Physical Disk (Client)/ Window Server 2003 Physical Disk and use the DeviceName property as the performance counter instance name.
Network Adapter:
For network adapter monitoring you should target your rule/monitor to Network Adapter (Server)/ Network Adapter (Client)/ Window Server 2003 Network Adapter and use the Performance Monitor Instance Name property as the performance counter instance name.
Web Site:
For website monitoring you should target your rule/monitor to IIS 2003 Web Site or IIS Web Site and use the PerfCounterInstance property as the performance counter instance name.
Database:
For SQL DB monitoring you should target your rule/monitor to SQL 2005 DB and use the Database Name property as the performance counter instance name. The other thing that you need to do is properly specify the performance object name. SQL Server has an object called SQLServer:Database that offers various performance counters about databases hosted on that SQL instance. For the rule/monitor to properly work with both named and default instances and in multi instance scenarios you need to specify the right performance object name. See the last example on how to specify the right performance object name for details. Specifically for the SQLServer:Database performance object the performance object name should be something like:
$Target/Host/Property[Type="SQLServer!Microsoft.SQLServer.DBEngine"]/PerformanceCounterObject$:Database
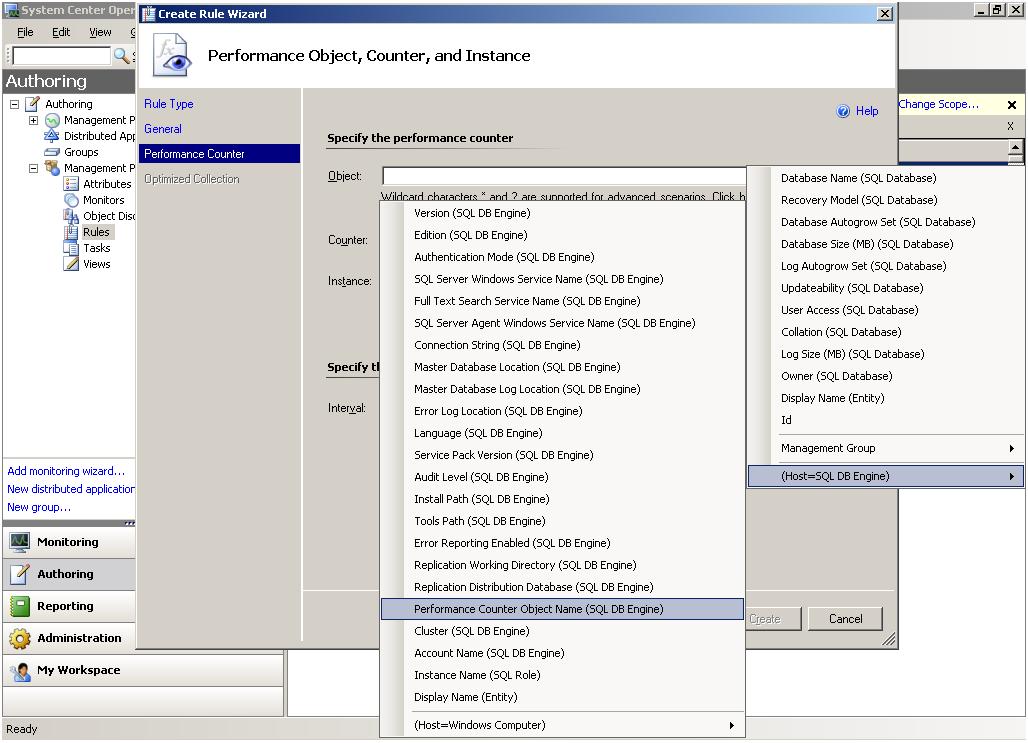
Here is a screen shot that shows how to pick the PerformanceCounterObject property using the UI:
Processor:
For Processor monitoring you should target your rule/monitor to Processor (Server)/Processor(Client)/Windows Server 2003 Processor. Note that by default the discovery for Windows Server 2003 processor is disabled. You will need to create an override to enable the discovery. You should use the Performance Monitoring Instance Name property as the performance instance name.
DB Engine (SQL Server Instance):
For monitoring the SQL Server 2005 DB engine you should target your rule/monitor to SQL 2005 DB Engine. Specifying the performance object is a little bit tricky in this case. The problem is that when you have multiple SQL instances installed on the same server, a performance object will be created for each one. Unlike the other examples that I talked about the problem here is that for each SQL instance, part of the performance object name will be different. For example, if I have two SQL instances installed where one is the default instance and the other one is a named instance called “INSTANCE2” you will see two performance objects in perfmon:
1. SQLServer:Databases – for the default instance
2. MSSQL$INSTANCE2:Memory Manager – for the second instance which is called INSTANCE2
In order to specify the proper performance object name for your rule/monitor that will work properly both for default instances and named instances as well as when multiple instances are installed you will need to do the following:
1. For the performance object name you will need to use the Performance Counter Object Name property. This will result in an expression which will be replaced at runtime with the right instance name.
2. Because the performance object name also contains additional text in addition to the instance name you will need to add this text manually in the performance object name edit box. The performance object name should look like this: $Target/Property[Type="SQLServer!Microsoft.SQLServer.DBEngine"]/PerformanceCounterObject$:Memory Manager