Overview of BizTalk Health Monitor (BHM)
Presentation
You probably already know or use “MsgBoxViewer” (aka “MBV”), a windows based application gathering all information of a BizTalk group and detecting any issues, non-critical or critical warnings. It is vital for a BizTalk administrator to have complete and detailed knowledge of a BizTalk group at any time, and detect any potential problems in advance. MBV has been perfectly achieving this task; but it remains a separated tool with its own user interface and HTML output and you have to run it periodically.
After releasing MBV as a standalone tool for several years, the MBV project team decided to integrate it more closely with the BizTalk Administration Console to provide BizTalk administrators a quick and complete dashboard of a BizTalk group which will help them monitor the health of their BizTalk platform.
A new BizTalk snap-in, named “BizTalk Health Monitor” (aka “BHM”), has so been created to help you easily monitor the health of your BizTalk environment. BHM is based on the same engine as MBV. This snap-in can be added to the existing BizTalk Administration Console or can be run individually in its own MMC window. Visit this post to learn more about how to register the BHM MMC with BizTalk MMC.
The first version of BHM is included in BizTalk 2013 R2 in the “Support tools” folder but updates will be released periodically with new features (and fixes if needed). The first update is almost ready and should be available soon.
Following are the major features of BHM:
- Monitor Multiple BizTalk Environments
- Generate and View MBV reports
- Dashboard view for overall health of BizTalk Environments
- Schedule Report Collection
- Send Email Notifications
- Performance Monitor integration with pre-loaded scenario-based Performance counters
- Report Management
Below is the detailed list of these features but we will go more in-depth for each feature in future posts.
Monitor multiple BizTalk Environments
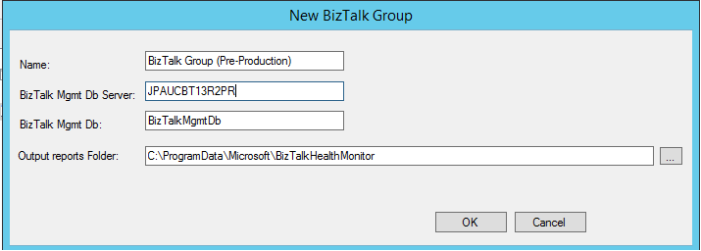
BHM Snap-in allows monitoring multiple BizTalk environments from a single MMC. When you register BHM on a BizTalk server, by default it will add a “group” node representing the current BizTalk group configured for this server. You can however add additional nodes corresponding to different BizTalk groups by specifying its name, the location of its Management database and the output folder.
Each group node will have its own customized settings in term of its level of information to collect, its level of information to display, its type of notifications to enable, or its type of performance data to collect.
This feature allows you to monitor multiple BizTalk platforms like Production and Pre-Production BizTalk groups from single MMC.
Generate and View MBV report
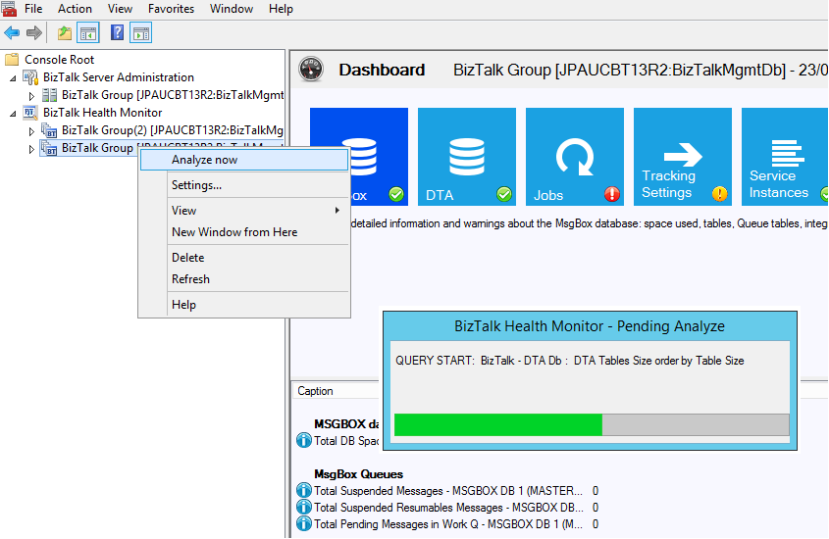
Once a group node is added in the BHM hierarchy, you can start immediately to analyze its corresponding BizTalk group by right-clicking on the node and select the “Analyze now” menu item.
The analysis consists of running a number of queries to collect all important information of the BizTalk group, evaluating a set of rules for each of them, and raising any warnings (critical or not) if there is any.
Note: The engine, the queries, and rules repository are the same as used by MBV.
Each time an analysis process is completed, a child node report is added in the group node. Each child report has further sub-nodes to present the collected information:
- Critical Warnings
- Warnings
- Summary
- Topology
- Queries

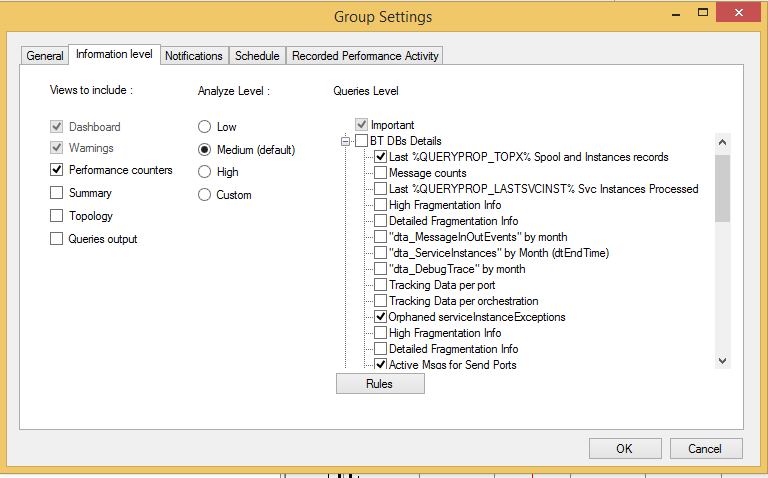
This sub-nodes list details depends on the level of information you selected to display in BHM. The property page Information level of the group node settings allows you to select which sub-nodes you want to display for each generated report, and the level of information to collect during the analysis process (as shown below). The more queries you select to include in the analysis, the more information and potentially more warnings BHM will raise.
You can so customize as you want the level of information to analyze and display in BHM for each added group node.
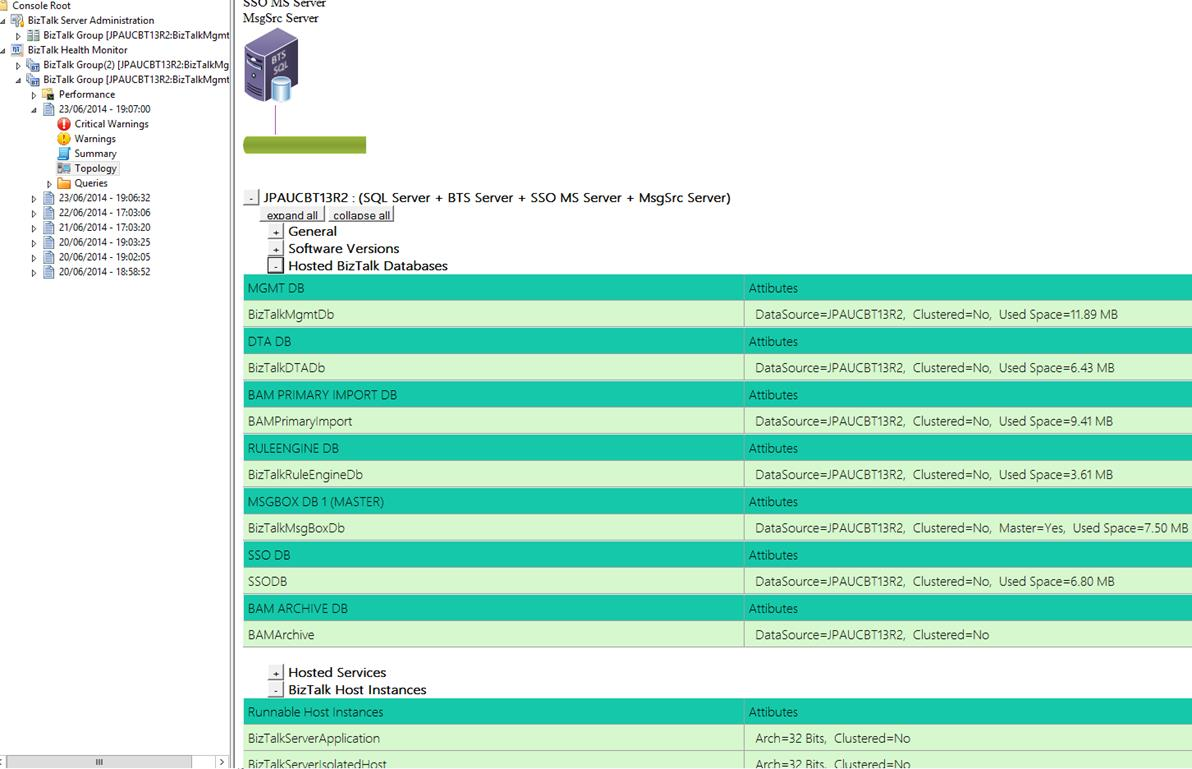
This is for example the output of the Topology sub-node :
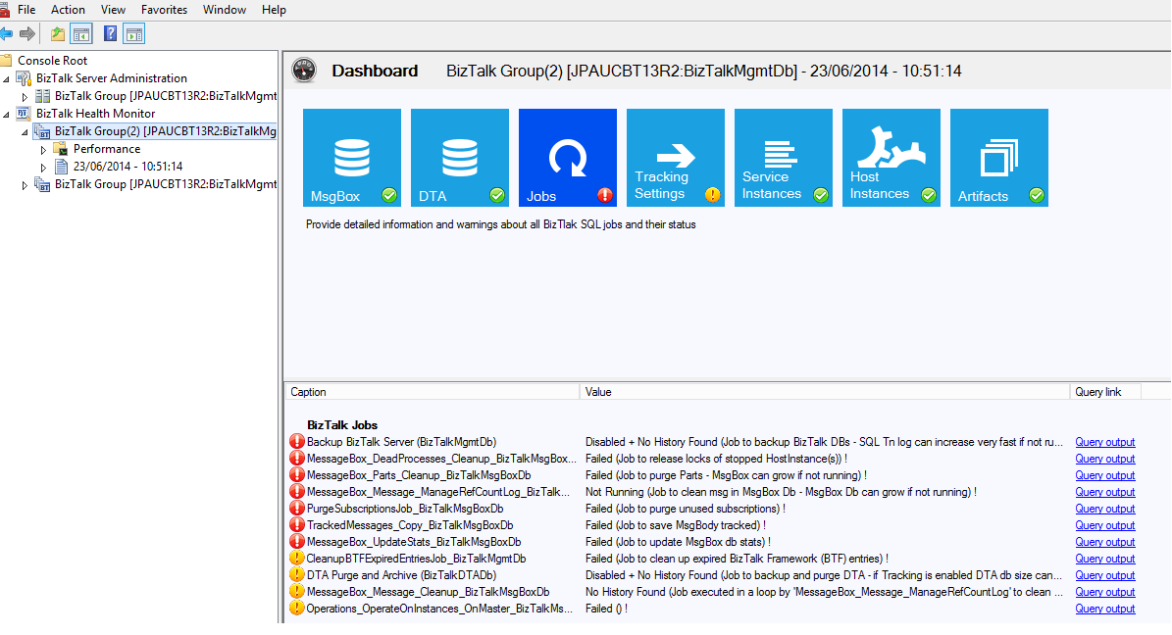
Dashboard view for overall health of BizTalk Environment
The output of the “Analyze Now” action will also generate a dashboard (as shown below) presenting a quick summary all the information you need to know about the BizTalk platform. We have categorized the information under different tiles as their names suggest. Each tile will be presented with a small icon on the bottom right of the tile which represents the overall health of that category. A green right mark shows that this category is healthy. A yellow exclamation sign represents some non-critical warnings whereas a red exclamation represents some critical warnings which need immediate attention. You can click on these tiles to get additional details on the lower pane.
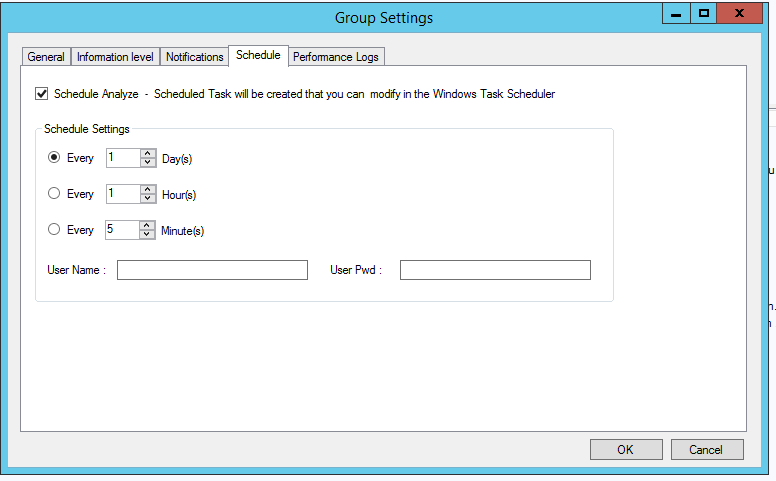
Schedule Report collection
A BizTalk platform processing messages 24x7 needs to be monitored at least daily. BHM provides you a way to create a scheduled task to automate a periodic collection of BHM report.
The property page Schedule of the group node settings provides an option to enable a scheduled analyze. This schedule task can be of course modified then in the Windows Task Scheduler.
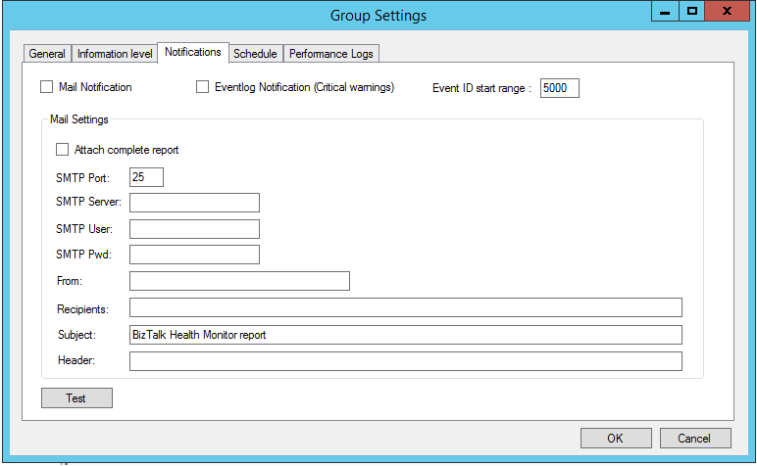
Send Email Notifications
Receiving by mail the list of warning that MBV generates is a feature that has been demanded by lot of MBV users. We have incorporated this feature in BHM where you have an option to send the dashboard and the list of warnings to an email address after a fresh analysis.
BHM provides so an option to send automatically by mail the dashboard and the list of warnings after a fresh analysis. You can enable and configure this feature from the property page of the group node settings (select the “Settings” menu item when right clicking on a group node). An email will also be sent each time if you have scheduled the BHM report collection.
We have also provided a Test button which you can use to test the SMTP settings you have entered. It will send a test email to make sure that SMPT settings are correct.
Perfmon integration with pre-loaded scenario based Performance counters
BizTalk provides a large number of performance counters to monitor like the state of the BizTalk databases, the BizTalk queues, the messaging and XLANG performances, the throttling states, the adapters performances etc…There are various such counters available but they are less known and visible to the BizTalk administrators.
BHM directly integrates Perfmon tool in its own MMC which provides a quick and easy way to monitor these counters. Furthermore, for each group node, BHM provides you a list of predefined views with pre-selected counters that you can quickly display at any time.
BHM will let you display either the current activity of the monitored BizTalk platform, or a recorded performance activity.
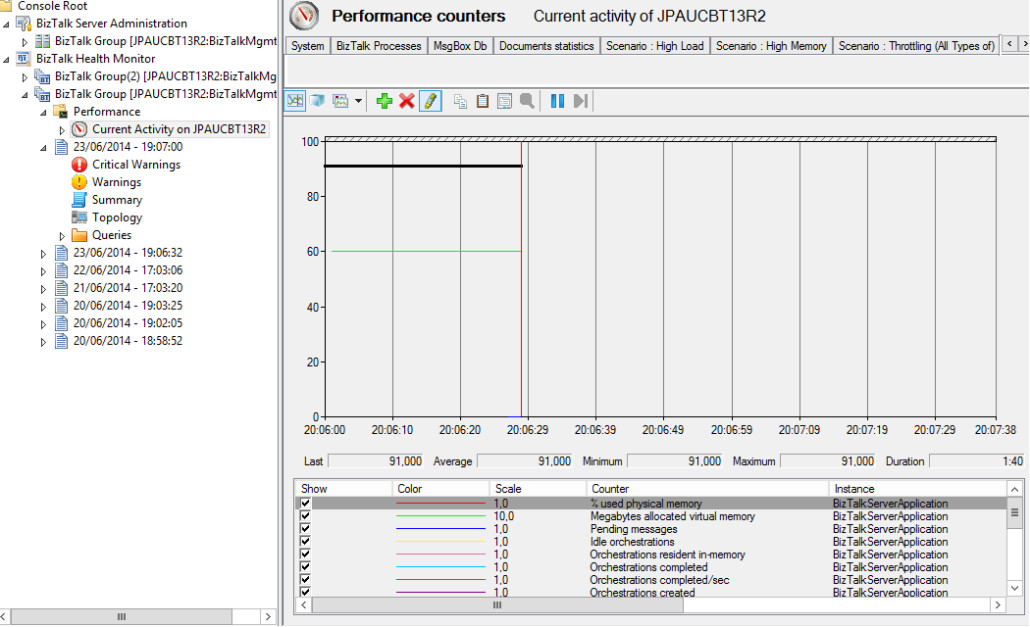
Current activity
When the current activity node is selected, you can choose a BizTalk server belonging to the monitored BizTalk group or any server you want. BHM provides default tabs in the current activity view with default counters but you can create your own tabs with your own counters (right-click on tab to display the context-menu and create a new one).
- Recorded activity
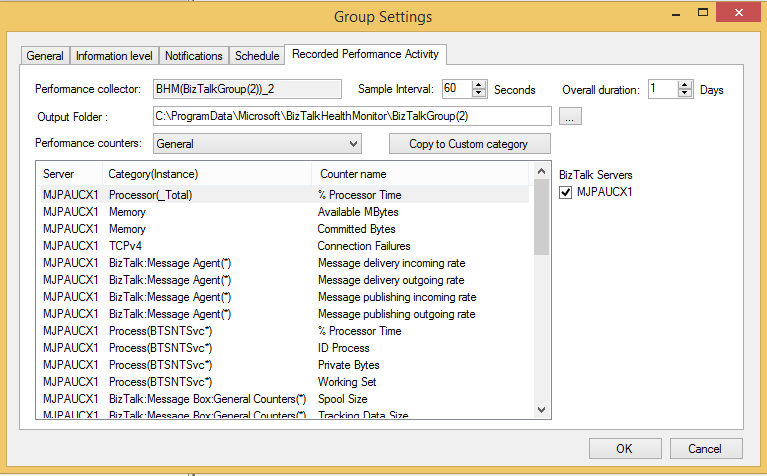
BHM can also automate the recording of a perfmon activity for a given period. You can enable and configure this feature from the property page Recorded Performance activity of the group node settings (as show below).
BHM provides you a set of pre-defined scenarios with selected performance counters and you can choose the preferred scenario. You can also add your own counters if you chose the custom scenario option. The property page allows you to configure the sample interval and the duration of the recorded activity.
Once the recorded activity is configured, BHM can automate the creation, the start & stop of a performance log file corresponding to the selected scenario. When the recorded activity is completed, you can display it inside BHM by selecting the corresponding sub-node (as show below).
