Transact-SQL Debugger for SQL Server 2008 – Part 3
In part 3 of working with the debugger, I’ll talk about how to set breakpoints and the trick to setting them in stored procedures and triggers.
This 3 part series covers:
- Basic debugging
- Configure remote debugging & best practices
- Debugging triggers and stored procedures with breakpoints
The trick with setting breakpoints in called stored procedures and triggers is that they need to be set within the temporary file that the debugger creates for the object.
In this scenario, I’m going to call the HumanResources.uspUpdateEmployeeHireInfo stored procedure in the 2005 version of AdventureWorks. This stored procedure updates two tables: Employee and EmployPayHistory both in the HumanResources schema. The goal of the example is to set a breakpoint in the trigger for the Employee table and then show how the debugger catches it the next time through.
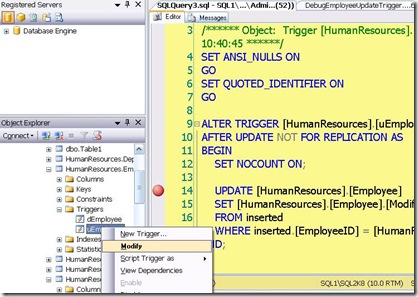
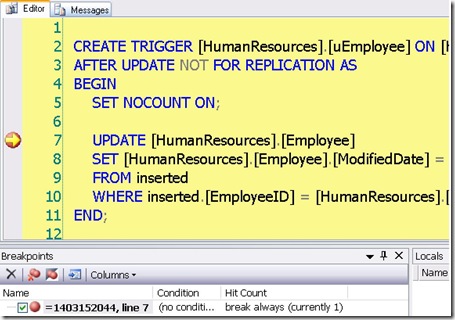
The obvious thing that you would try is to Modify the trigger and then toggling the breakpoint [F9] on the line you want to stop at. The problem is that the debugger has no context. so the approach shown below won’t work.
What you need to do is step into the stored procedure or trigger you want to break on and set the breakpoint in the temp file the debugger creates.
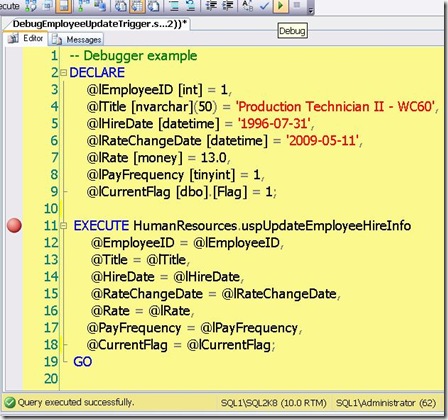
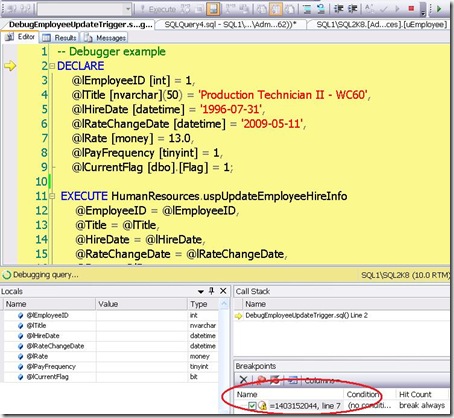
Let’s step through the example starting with the script to call the stored procedure.
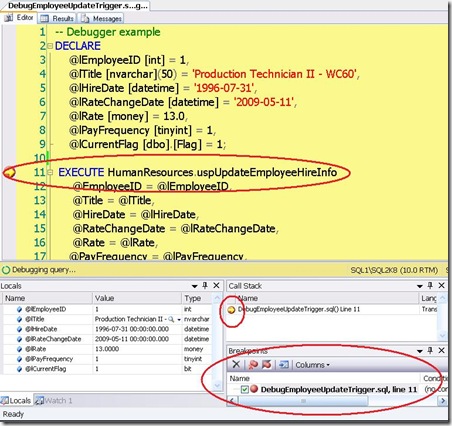
I’ve toggled the breakpoint to demonstrate how breakpoints can be set in a script of batch statements. When U press [ALT]+[F5] twice to start and continue debugging, you’ll see the debug stops at the break point in the script.
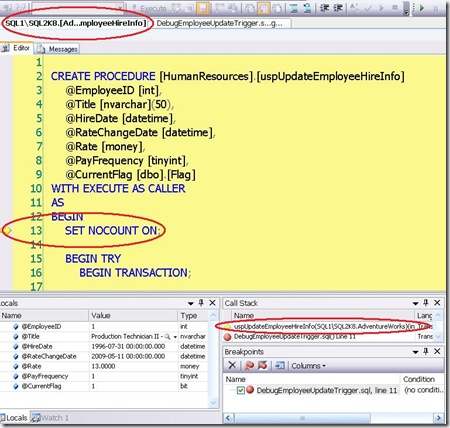
You will now want to Step Into the stored procedure with [F11]. The debugger loads up the stored procedure into a new editor window and stops at the first executable line.
Notice in the Call Stack window that procedure name is followed by (SQL1\SQL2K8.AdventureWorks) indicating the server instance and database name context for the debugging session. If you hover over the statement, you will see a tool top showing the parameters with values called and the current line.
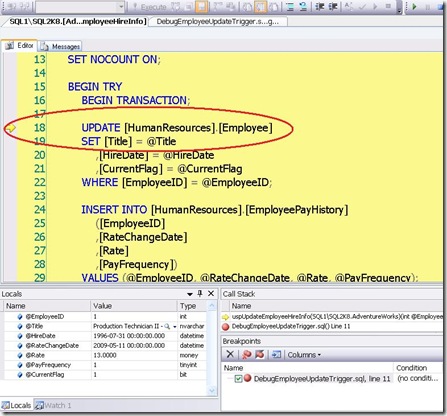
Step into [F11] again moves to the BEGIN TRY statement. [F11] again to the BEGIN TRANSACTION statement. One more [F11] positions you on the UPDATE statement for the Employee table.
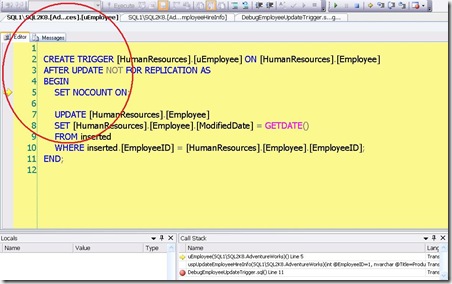
Step into [F11] the UPDATE statement causes the debugger to load the update trigger for the Employee table.
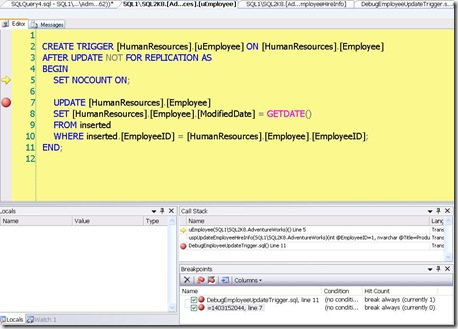
At this point, we can now set a breakpoint [F9] on the UPDATE statement for the trigger.
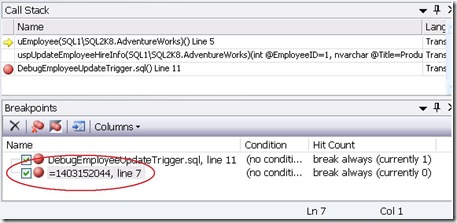
In the breakpoint window for this example, you’ll notice something interesting.
You’ll see that the debugger is actually showing the object_id for the trigger name. This way the the debugger can keep track of the breakpoint for future sessions.
For now, lets press [ALT]+[F5] to let the debugger continue. Lets test out the breakpoint for the trigger.
First toggle off the breakpoint [F9] in line 11 of the calling script. Then press [ALT]+[F5] to start the debugger. You’ll see that the breakpoint is still present in the Breakpoint Window.
One more continue [ALT]+[F5] stops right where you want!
Let’s finish the debug session with the Continue command [ALT]+[F5].
At this point, I should point out that breakpoints are persisted with the database solution/project. If you didn’t have solution, any breakpoints you defined will go away when you close SSMS. To learn more about solutions, you can refer to the help topic – Using Solution Explorer.
Technorati Tags: SQL Server Mangement Studio,SQL Server 2000,Transact-SQL Debugger
