Dealing with RequestRateTooLarge errors in Azure DocumentDB and testing performance
In Azure DocumentDB support, one of the most common errors we have seen as reported by our customers is RequestRateTooLargeException or HTTP Status code 429. For example, from an application using DocumentDB .Net SDK, we may see an error like this –
System.AggregateException: One or more errors occurred. ---> Microsoft.Azure.Documents.DocumentClientException: Exception: Microsoft.Azure.Documents.RequestRateTooLargeException, message: {"Errors":["Request rate is large"]}, request URI: rntbd://xx.xx.xx.xx:xxxx/apps/1240113d-9858-49b9-90cb-1219f9e1df77/services/04a5d10f-f937-40b1-9c70-d12d7f30cd51/partitions/8557b0cc-e4b7-4fb0-8bdd-406bc987e4cb/replicas/130729572321838873p ActivityId: f6371eb8-ce57-4683-bdc4-97a16aa3fe35
What we have seen is, the error may lead to some confusion or in other words, it may not be always obvious why we are running into this error. In this blog, we will try to clarify the error and share some tips or steps you can take to deal with this error in your application.
What does the error 'RequestRateTooLarge' mean?
The error is by design, it means that an application is sending request to DocumentDB service at a rate that is higher than the 'reserved throughput' level for a collection tier. You may remember from our documentation that Azure DocumetDB has 3 collection tiers – S1, S2 and S3 with each having their 'Reserved Throughput' in Request Units per Second. For example, an S3 collection has 2500 Request Units/sec and an S1 collection has 250 Request Units/sec as Reserved Throughput. So, if you have an application using an S1 collection and the application is sending requests at a rate more than 250 Request units/sec, you will run into this error. This is explained nicely in this blog –
"When a client attempts to exceed the reserved throughput for an account, there will be no performance degradation at the server and no use of throughput capacity beyond the reserved level. The server will preemptively end the request with RequestRateTooLarge (HTTP status code 429) and return the x-ms-retry-after-ms header indicating the amount of time, in milliseconds, that the user must wait before reattempting the request.
HTTP Status 429,
Status Line: RequestRateTooLarge
x-ms-retry-after-ms :100
"
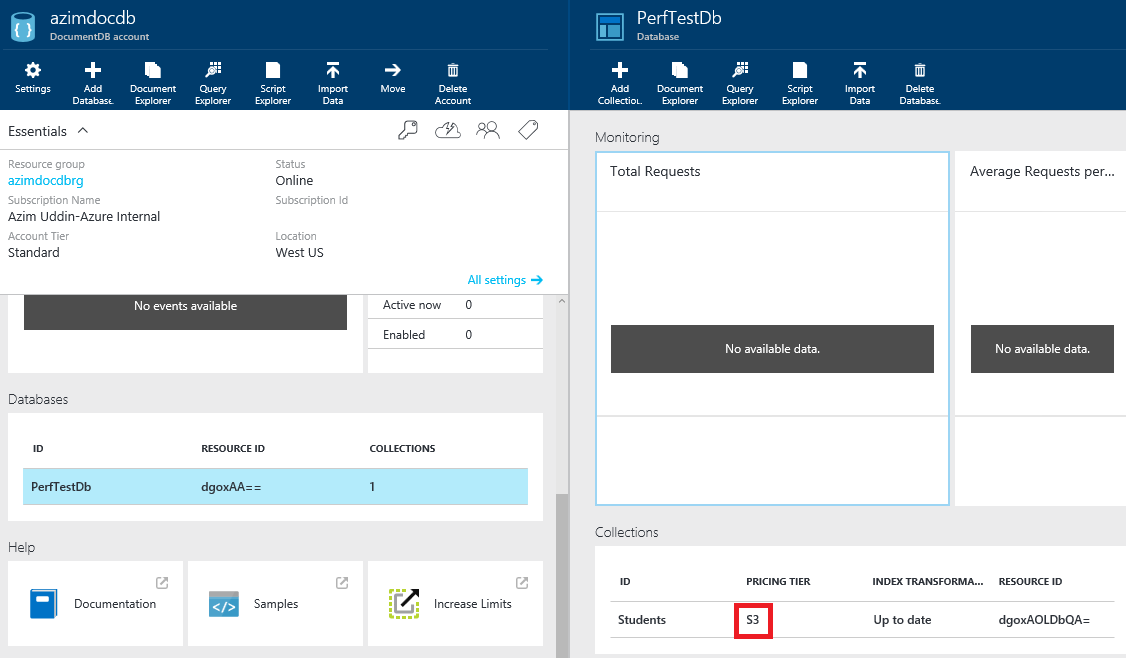
You can verify your collection Tier from the Azure Portal, like below -
Dealing with 'RequestRateTooLarge' errors:
Measure RequestCharge:
When troubleshooting RequestRateTooLarge errors, a good place to start is to measure the overhead of those operations (create, read, update or delete) that are likely resulting the error and examine the x-ms-request-charge header (or the equivalent RequestCharge property in ResourceResponse<T> or FeedResponse<T> in the .NET SDK) to measure the number of Request Units (or RU) consumed by these operations. Here is an example -
In my case, I am using a Student Document and the output is something like this -
Insert Operation, # of RUs: 9.14
So, If I was using an S1 collection (with 250 Request Units/sec as reserved throughput), I can expect to insert roughly 27 (250/9.14) Student documents within a second and if my application starts sending insert requests at a higher rate, I would expect to run into RequestRateTooLarge error. You can leverage Azure DocumentDB Studio tool to inspect the x-ms-request-charge request header and other useful testing.
Retry Operations:
If you are using .Net SDK with LINQ, it automatically retries the operation internally when faced with an http 429 (default retry is set to 3, as of today), as explained in this blog. But there are scenarios where default retry behavior from the SDK may not be sufficient – in such cases, the application can handle the RequestRateTooLargeException (http status code 429) and retry the request based on the 'x-ms-retry-after-ms' header to improve resiliency of the application. Here is an example of retry using the .Net SDK-
Here is a similar example using node.js
Move to higher Collection Tier:
After you have implemented retry policy like the example above, monitor your application to see how frequent you are running into http 429 errors (being handled by your retry policy) and if the retry is creating a significant latency in your application. If your application is constantly exceeding the reserved throughput of a collection tier, resulting a large number of http 429 errors and significant latency, you may want to consider a higher Collection Tier and test your application. For example, if your application is currently using S1 collection Tier, try an S2 collection tier and so on.
Cache Collection or Database Id/self-links:
In certain cases, the RequestRateTooLarge errors may not be coming from CRUD operations on the documents within a collection – it may happen while querying 'Master Resources' such as querying to find if a collection or Database exists (via APIs such as CreateDatabaseQuery or CreateDocumentCollectionQuery in the .Net SDK). Here is an example–
We had a recent case, where a customer was using a third party node.js SDK and we noted that the application was querying to check the existence of the same database and collection over and over, thereby running into this error. To avoid such scenarios, we recommend that you cache the database and collection id or self-link and re-use.
Follow Performance best practices:
While dealing with this error, the question about performance and throughput always comes into picture. Please ensure that you have reviewed part1 and part2 of the blog on performance tuning by our Product team. For example, as recommended in part1, ensure that you are using Tcp protocol and Direct Mode in the ConnectionPolicy when throughput is a priority.
Partition Data into multiple collections:
If you are using the highest collection Tier (S3, as of today) and have followed all the best practices including retry but you are still getting large number of RequestRateTooLarge errors and are having significant latency as a result of retry, this indicates that your application throughput requirement is higher than what a single S3 collection can handle and should consider partitioning your data into multiple S3 collections, with each collection getting a max of 2500 Request Units/sec. For guidance on using partitioning with DocumentDB, please review our documentation here and here. Ideally this should happen during the design, prototyping and testing phase of your application.
Testing DocumentDB Performance and Scalability:
One other relevant question/comment we have seen from customers is – "I am not reaching the RU levels that an S3 "promises" and am getting responses that indicate RequestRateTooLarge when it should not be" or "how do I get the maximum throughput promised from an S3 collection?". To take full advantage of maximum throughput offered by a collection tier, we may need some tweaking in the client application code, such as, sending requests in multiple threads instead of a single thread. The "trick" is to push hard enough to get a small rate of throttles (RequestRateTooLarge error) consistently, then backing off from there.
To show this, I have written a GitHub sample that tests the performance of various operations like insert, Read, BulkInsert etc. In the sample, I have tried to measure DocumentDB performance by sending a large number of (I have tested with 1000 or 10000 - we can go higher) inserts/reads/bulk-inserts and measured 'Average Request units/sec' and 'ops/second' (such as inserts/sec or reads/sec) by increasing the number of threads (thereby pushing DocumentDB harder) until I found an optimal number of threads that resulted the best performance.
I'm pretty sure there are better ways of coding this and measuring the average Request units/sec etc - I am just sharing some ideas. Please feel free to leverage/tweak the sample with your own Documents. Here are some sample results I got while testing insert performance with an S1 collection and Student document I showed above (with 9.14 Request units/sec for each insert) -
With 4 threads:
8/23/2015 12:23:13 AM Result for Collection: Students in Tier: S1
Result Summary:
******************************
Number of Threads used: 4
1000 Documents Inserted in 44.294 seconds
Operations per Second: 22.5764211857136
Average Request Units: 206.348489637424 per second
With 8 Threads:
8/22/2015 11:46:55 PM Result for Collection: Students in Tier: S1
Result Summary:
******************************
Number of Threads used: 8
1000 Documents Inserted in 34.907 seconds
Insert Operations per Second: 28.6475492021658
Average Request Units: 261.838599707797 per second
With 16 Threads:
8/23/2015 12:10:41 AM Result for Collection: Students in Tier: S1
Result Summary:
******************************
Number of Threads used: 16
1000 Documents Inserted in 77.278 seconds
Operations per Second: 12.9402934858563
Average Request Units: 118.274282460727 per second
As you can see - with inserts being done in 4 threads I still haven't got the maximum RU/sec (250) for S1 collection, with 8 threads I got the best RU/sec (even though there were a few RequestRateTooLarge errors). With 16 threads, I got too many RequestRateTooLarge errors which impacted the latency and resulted a poor performance. I wouldn't focus on the numbers I got from my test results, this will vary for specific documents being used and other factors like the setup of the tests (like the applications running on a workstation vs Azure VM in the same datacenter where DocumentDB account is etc), but the approach I am taking in testing performance.
I hope you find it helpful! Please send us your comments, questions or feedback :-)
-Azim