
VS Team Services incidents on Feb 3 & 4
Worldwide outage causing login problems and extraordinarily slow response times
- Start time: 09:11 GMT on Feb 4
- Duration: 5 hours, 20 minutes
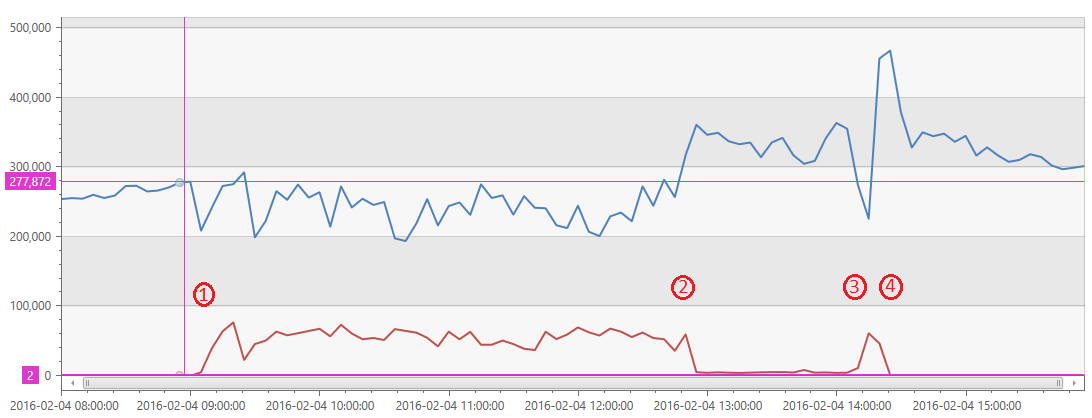
Let me start by characterizing the incident a bit. The root problem was in a service called SPS that handles accounts, identities, authorizations and the like. It’s really the last remaining “global” service in VSTS. Below you see a chart of failed requests (red) and succeeded requests (blue), bucketed to 5 minute intervals, during the period of the incident. I’ve marked 4 important points of the graph.
- The incident started. You can see a dramatic rise in failed requests starting at 09:00 GMT. In the 4 hours that followed, a fairly common (for incidents) sequence happened – we started getting alerts, our 24×7 team investigated, confirmed the problem, called engineers and got them out of bed (which involved engineers from my team and SQL Azure) and worked on diagnosing it.
- At this point we understood what was happening and we modified a stored procedure to fail immediately so that, rather than the whole system being down, only a subset of functionality was broken and you can see the volume of failed requests fall, not back to normal, but a lot and succeeded requests rise.
- Now we really understand exactly what is happening and believe we have the “real” fix for the problem that should completely restore the system to normal. We applied a fix and removed the short circuit in the stored procedure. The fix was not quite right and the error count shot back up.
- Within about 15 minutes, we had adjusted the fix, applied it and everything returned to normal.
 So what happened? The root cause is that we (the Team Services team) changed the SQL Azure query processor compat level from 100 (SQL Server 2008) to 120 (SQL Server 2014) on one of the SPS databases. Over time, we had some drift in database compat levels in the service and we were trying to clean them up.
In the SQL Server 2014 query optimizer they made significant changes to the cardinality estimation. I’m sure they were improvements but not for this query. The cardinality estimation was used to estimate a memory grant for the query (SQL preallocates memory for queries to avoid spills to disk, which are big performance problems and additional memory allocations, which create the possibility for deadlocks. The cardinality estimate is an important input into the memory request).
In this query, the memory grant estimation shot up from something pretty small to 3.5GB. Given that the server only has 48GB, that meant that it could run very few of these queries before it ran out of memory, causing every query in the system to back up and, essentially, serialize. That caused a traffic jam and resulted in so many of our customer requests timing out/failing.
The ultimate resolution, for now, is that we added a hint to the query that tells the query optimizer the maximum memory grant to use for the query. It’s expressed in % of memory and, for simplicity’s sake, we set it to 1% of the memory available for this (or more on the order of 160MB). That was enough to unclog the system and allow everything to flow freely.
Longer term, littering our code with memory grant limits is a very unsustainable practice. We use query plan hints a lot but memory grant caps are too fragile over time. So we are working with the SQL team see about changes in the cardinality estimator that will do better for this query and others like it. There are also changes we can make to the way this query is written that will reduce the likelihood of mis-estimations. It turns out that in most cases, this query only operates on 1 row but from a very big table. The cardinality estimator guessed a lot more than 1 row.
Here’s a greatly simplified view of the response timeline for the incident:
So what happened? The root cause is that we (the Team Services team) changed the SQL Azure query processor compat level from 100 (SQL Server 2008) to 120 (SQL Server 2014) on one of the SPS databases. Over time, we had some drift in database compat levels in the service and we were trying to clean them up.
In the SQL Server 2014 query optimizer they made significant changes to the cardinality estimation. I’m sure they were improvements but not for this query. The cardinality estimation was used to estimate a memory grant for the query (SQL preallocates memory for queries to avoid spills to disk, which are big performance problems and additional memory allocations, which create the possibility for deadlocks. The cardinality estimate is an important input into the memory request).
In this query, the memory grant estimation shot up from something pretty small to 3.5GB. Given that the server only has 48GB, that meant that it could run very few of these queries before it ran out of memory, causing every query in the system to back up and, essentially, serialize. That caused a traffic jam and resulted in so many of our customer requests timing out/failing.
The ultimate resolution, for now, is that we added a hint to the query that tells the query optimizer the maximum memory grant to use for the query. It’s expressed in % of memory and, for simplicity’s sake, we set it to 1% of the memory available for this (or more on the order of 160MB). That was enough to unclog the system and allow everything to flow freely.
Longer term, littering our code with memory grant limits is a very unsustainable practice. We use query plan hints a lot but memory grant caps are too fragile over time. So we are working with the SQL team see about changes in the cardinality estimator that will do better for this query and others like it. There are also changes we can make to the way this query is written that will reduce the likelihood of mis-estimations. It turns out that in most cases, this query only operates on 1 row but from a very big table. The cardinality estimator guessed a lot more than 1 row.
Here’s a greatly simplified view of the response timeline for the incident:
- 1 minute – Incident team engaged
- 10 minutes – first engineer engaged
- 1 hr and 42 minutes – We now understood the issue well enough to know we have a SQL problem with a specific query and the first SQL Azure engineer joined the call.
- 2 hrs and 24 minutes – A top SQL Azure live site engineer joined the call. I’m trying to be sensitive about how I say this because I don’t mean to degrade anyone in the process. However, from years of doing this, I’ve learned there are engineers and then there are gods of live site debugging. Every good service has a few but they are very hard to come by and you have to be careful because you can’t pull them into every incident or they will never have a life and will quit. This is the milestone where we got one of those from SQL Azure. Along the way we had many excellent engineers join and help. I’d say when I was on the call, I saw probably 30 engaged on it.
- 2 hours and 57 minutes – A top live site engineer from VSTS joined.
- 3 hours and 38 minutes – The first mitigation was put in place restoring the service to partial usability.
- 5 hours and 13 minutes – Issue fully resolved and system back to full health.
In any incident, there are many things that we look at. And given that this just happened a little over 24 hours ago, we aren’t nearly done. But here’s a summary of some of the things that matter.
- 4.5 hours to the first mitigation – The incident log show solid engagement with an engineer out of bed and on the problem within 10 minutes. I need to get someone to go through the transcript and diagnostic actions with a fine toothed comb to see what we can learn from it. I’m sure there are things we could have done better. The one thing that jumps out at me is, given it was a world wide, whole service event, did we get our top live site engineers on the call fast enough? I kind of feel like we didn’t acknowledge and respond to the severity of the incident quite the way I would like.
- Improvements in cardinality estimation – Clearly the SQL server team has some work to do to further tune the new cardinality estimator and they are all over that.
- Changes to our query – We can make some changes to this query to make it less fragile.
- Circuit breakers – We spent a lot of effort in the past year building circuit breakers that help the over all service be resilient in the fact of incidents in fractions of the service – and we have lots of evidence that it has made a huge difference in the severity of incidents that occur. But we can see by this incident, and even more so by the next one I’m going to talk about, that we have some tuning to do. The automatic circuit breakers didn’t mitigate this and it was, ultimately and manually applied circuit breaker (stored proc change) that provided the first mitigation.
- Anomaly detection – Ironically, one of the things I’ve been talking with the team about recently is improving our ability to use our copious amounts of telemetry to detect changes in important KPI (in this case memory grant requests) before and after every single change we make to the service. The change to the compat level was made days before this incident and if we had had anomaly detection on that KPI, it would have alerted us to an important behavioral change that could have prevented this incident. Luckily we just release an anomaly detection feature in Application Insights and we are going to see how we can use that technology to identify issues like this in VSTS.
- SQL Compat levels – We should not have let our compat levels drift so much and we need to put processes in place that keep us more up to date.
- SPS partitioning – We need to eliminate SPS as a single global service and partition it into multiple instances so that, even when there is a severe incident, it’s not worldwide. That work was already high on the back log. In fact, some of the prerequisites to enabling it are already in-flight.
on to incident #2…
Worldwide incident causing slow response times and missing UI elements
- Start time: 3:30 GMT on Feb 3
- Duration: 3 hours
The graph below shows percentile of response time for all requests during the incident as measured from the browser in milliseconds. You can see from the chart that less than 10% of requests were impacted.
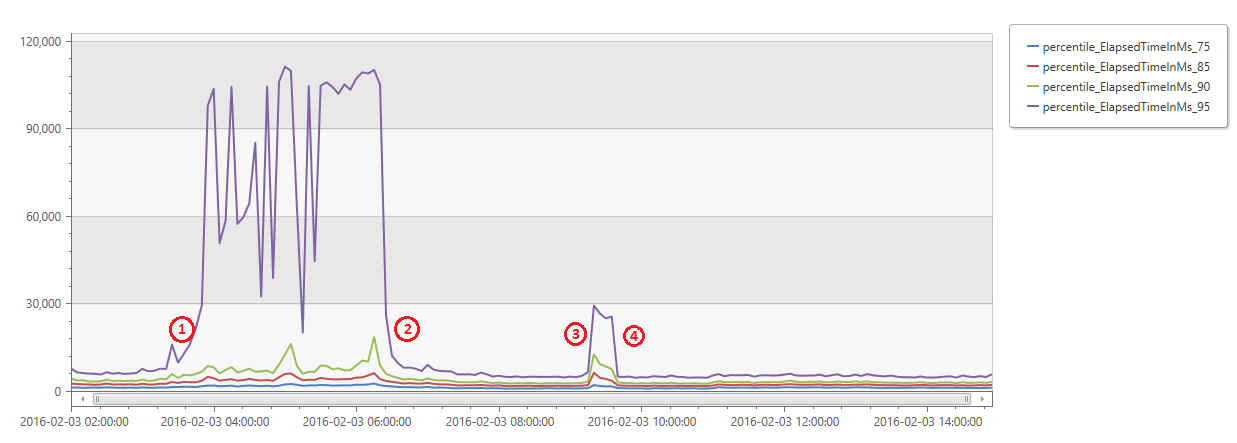
- The incident started. At around 3:30 UTC we saw a large spike in response times from less than 10% of the requests coming from the browser. At this point alerts fired and we engaged our on-call DRIs.
- At this point we understood the issue to be missing Azure DNS entries for our services, and mitigated the issue by disabling the job that was deleting the DNS entries and re-creating them by hand.
- A second incident was triggered which was actually a pre-cursor to the incident above.
- The incident was mitigated by failing over to the secondary SQL server.
Why did we have a job deleting DNS entries? For each customer’s account for each service in VSTS, we use the Azure DNS service to create a DNS entry that directs that particular account to a particular service’s scale unit. This way DNS will resolve the correct scale unit to direct the http requests to that account. Every Wednesday, we run an automated clean up job that goes through and deletes DNS entries for deleted, rename, abandoned, etc. accounts. This job has been in place and functioning without incident for a very long time. Recently, as part of our work to enable multiple Team Project Collections per account, some changes were made to this job that introduced a bug. That bug caused not only orphaned account DNS entries to get deleted but also our top-level service DNS entries to get deleted – meaning that calls from the client directly to a top-level service would timeout and fail with host not found errors. It is interesting to note that this did not impact our server response times, only response times measured from the browser, because our servers had the DNS entries cached for server to server calls. This was clearly a big miss in our testing. How did we miss it? The cleanup job runs weekly, and we had a bug in the cleanup job that was masking this bug. The bug fix rolled out as a hot fix two weeks into the deployment cycle, which triggered the second bug. The second blip in response time had the same root cause as the incident described above, so it was really a separate incident. It was mitigated by failing over to the secondary SQL server. We didn’t do enough to dig into the root cause of this incident with urgency, which could have prevented the second incident from happening. Here’s a rough timeline for this incident:
- 1 minute – Incident team engaged
- 7 minutes – first engineer engaged
- 1 hour – We determined the issue was due to missing Azure DNS issues, and engaged the Azure DNS team.
- 2 hours and 20 minutes – Azure DNS team determined from their logs that we were deleting the records.
- 2 hours and 40 minutes – We discovered the Azure DNS cleanup job was running and disabled it to stop the damage.
- 2 hours and 45 minutes – We started recreating Azure DNS records manually.
- 3 hours – incident mitigated
We learned a lot from this incident, here are some of the things we are doing to improve the service as a result of it:
- Get smarter about the DNS entries we delete. We are hardening the Azure DNS cleanup job to only delete actual account DNS entries, and to never delete top level service entries.
- Reduce time to root cause the issue by improving our tracing in this job, and educating more of the team on how we handle Azure DNS entries through better documentation and training.
- Improve our resiliency when we are experiencing service to service or browser to micro-service outages so the site remains operational for all users. We will do this by tuning our circuit breakers and improving our service to service exception handling to fall back to a degraded experience when this class of incident happens.
- Root cause every incident after mitigation. If we had root caused the second blip in the response time graph, we would have discovered the SQL issue and could have prevented the incident that occurred the following day.
I want to say again I am very sorry these incidents happened. We know how much this impacts you because we use the service every day and our teams are impacted too, so we know how painful it is. We are taking every measure to learn from these incidents and make the service better. Brian
 Light
Light Dark
Dark
0 comments