
Dogfood I/O Analysis
I’ve been falling so far behind on everything I’m supposed to do I just can’t stand it. Today is my day to try to catch up on blogging. I promised I’d follow up on the dogfood I/O analysis from the Orcas upgrade. Well, I got the results a week or two ago and I just can’t find anything particularly useful. The problem is that the data we have from the various samples we’ve taken over the last year are all different enough that it’s hard to compare apples to apples. We haven’t used the same methodology. We’ve reconfigured the drives and repartitioned tables, etc. To a first approximation I’ve given up trying to extract useful before and after I/O data. Instead we are going to run another trace to see which sprocs now have the highest I/O demand and focus on just making those better and worry less about quantifying the improvement.
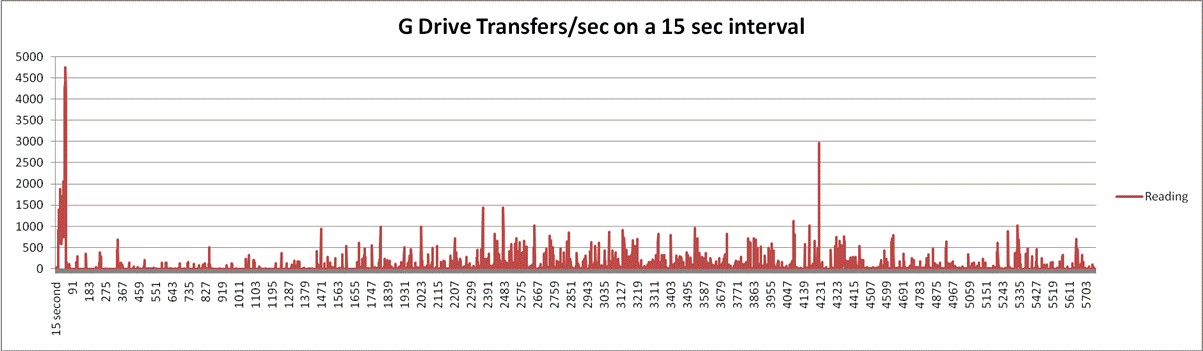
In case you care, here’s some data we got from the last set of I/O analysis – at least you can see in the absolute what kind of I/O load we are seeing. As I’ve said before, Version Control is really where all of our I/O load is, so that’s where we focused. Also, you’ll note we’ve broken the Version Control tables across multiple volumes due to the high load. Here’s how the tables map to drives:
- G: tbl_LocalVersion
- J: all the remaining tables in version control.
- K: tbl_Version


If you can extract useful info from this, please let me know 🙂 Once we get the break down by sproc, I’ll share that.
Thanks,
Brian
 Light
Light Dark
Dark
0 comments