Creating custom reports against the System Center Operations Manager 2007 R2 data warehouse
It is possible to create custom reports, using SQL Server 2008 Reporting Services, against the System Center 2007 R2 data warehouse.
Reports can be designed in SQL Server 2008 Reporting Services to provide the end user with a better representation of the data since the built-in System Center reports are not ideal.
Fortunately the OperationsManagerDW database schema is documented on MSDN https://technet.microsoft.com/en-us/library/gg508713.aspx along with code samples which makes the task of creating a custom report a little easier.
Stored procedures were implemented to return the data from the OperationsManagerDW schema. I prefer this approach as it provides more control over the code rather than embedding logic in the report itself. Incidentally, the stored procedures were hosted in a separate database to avoid support issues embedding these in OperationsManagerDW database.
An example of the stored procedure logic to query the OperationsManagerDW is below:
    1: /********************************************************************************************
    2:  *
    3:  *    (c) Microsoft 2010  All rights reserved
    4:  *
    5:  *    The code contained in this file is provided "as is" without any warranty of any kind.
    6:  *    The code is for reference purposes only and must not be relied on in connection with
    7:  *    any operational purposes.
    8:  *    Please refer to the terms and conditions which cover the provision of consulting
    9:  *    services to you.
   10:  *
   11:  ********************************************************************************************
   12:  *
   13:  *          The following parameters are required:
   14:  *          pSlot            (nvarchar, 255)
   15:  *            pCurrentDate    (datetime)
   16:  *
   17:  ********************************************************************************************
   18:  *
   19:  *          Stored Procedure Creation Script
   20:  *          [usp_ReportPerfCounterHealth]
   21:  *
   22:  *===========================================================================================
   23:  * Modification History
   24:  *-------------------------------------------------------------------------------------------
   25:  * Verion    Date        Author                Description
   26:  *-------------------------------------------------------------------------------------------
   27:  * 01.00.00  10/01/2011  B Wright-Jones        Created
   28:  ********************************************************************************************/
   29:
   30: CREATE PROCEDURE [Schema].[usp_ReportPerfCounterHealth]
   31:     @pSlot nvarchar(255),
   32:     @pCurrentDate datetime
   33: AS
   34:
   35:     SET NOCOUNT ON;
   36:
   37:     SELECT
   38:             [vME].[Path] AS [ServerName],
   39:             [vPR].[ObjectName],
   40:             [vPR].[CounterName],
   41:             [vPRI].[InstanceName],
   42:             AVG(SampleValue) AS Average,
   43:             MIN(SampleValue) AS Minimum,
   44:             MAX(SampleValue) AS Maximum,
   45:             SUM(SampleValue) AS SumOfValue
   46:
   47:     FROM
   48:             [dbo].[vPerformanceRule] vPR
   49:
   50:             INNER JOIN    [dbo].[vPerformanceRuleInstance] vPRI
   51:             ON            vPR.[RuleRowId] = vPRI.[RuleRowId]
   52:
   53:             INNER JOIN    [Perf].[vPerfRaw] vPRW
   54:             ON            [vPRI].[PerformanceRuleInstanceRowId] = [vPRW].[PerformanceRuleInstanceRowId]
   55:
   56:             INNER JOIN    [dbo].[ManagedEntity] vME
   57:             ON            [vPRW].[ManagedEntityRowId] = [vME].[ManagedEntityRowId]
   58:
   59:     WHERE
   60:             [vPRW].[DateTime] BETWEEN DATEADD(Hh, -24, @pCurrentDate) AND @pCurrentDate            -- Filter for the last 24 hours
   61:             AND vPR.[CounterName] = '<Performance Counter goes here>'                            -- Filter for the specific performance monitor counter
   62:             AND vPRI.[InstanceName] = '<Instance goes here>'                                    -- Filter for the specific slot
   63:
   64:     GROUP BY
   65:             [vME].[Path], [vPR].[ObjectName], [vPR].[CounterName], [vPRI].[InstanceName];
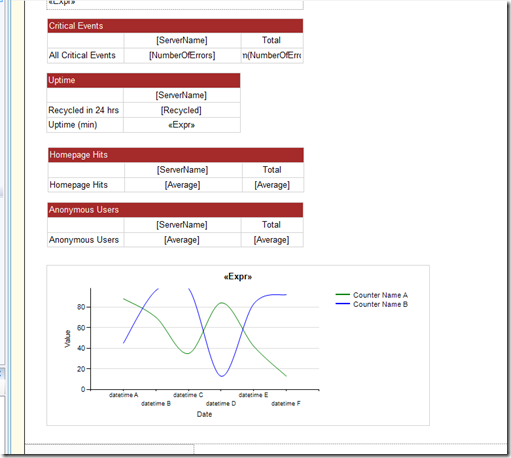
The design time report is shown below. The line graph shows specific counter values over the period of a month e.g. processor utilisation, web service requests etc. whereas the tablix controls display critical events, uptime, hits and so on for each server in the farm.
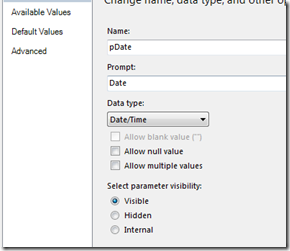
A datetime parameter was implemented in order to allow the user to select a date from the calendar control
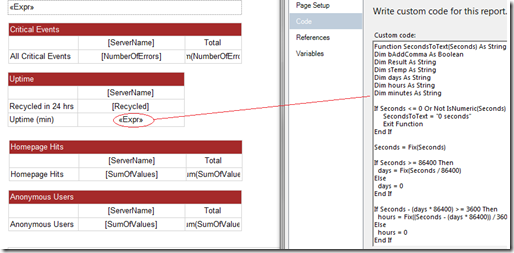
The uptime field displays the result of a custom counter which is the number of seconds since the service was started. I implemented a vb function (shown below) on the report body to transform this into days, hours, minutes which is more readable for the end user.
The expression references the custom code using the following syntax:
=Code.SecondsToText(Fields!AppPoolUpTimeSec.Value)
The Visual Basic function to format the seconds as days, hours, minutes is below:
    1: Function SecondsToText(Seconds) As String
    2: Dim bAddComma As Boolean
    3: Dim Result As String
    4: Dim sTemp As String
    5: Dim days As String
    6: Dim hours As String
    7: Dim minutes As String
    8:
    9: If Seconds <= 0 Or Not IsNumeric(Seconds) Then
   10:      SecondsToText = "0 seconds"
   11:      Exit Function
   12: End If
   13:
   14: Seconds = Fix(Seconds)
   15:
   16: If Seconds >= 86400 Then
   17:   days = Fix(Seconds / 86400)
   18: Else
   19:   days = 0
   20: End If
   21:
   22: If Seconds - (days * 86400) >= 3600 Then
   23:   hours = Fix((Seconds - (days * 86400)) / 3600)
   24: Else
   25:   hours = 0
   26: End If
   27:
   28: If Seconds - (hours * 3600) - (days * 86400) >= 60 Then
   29:  minutes = Fix((Seconds - (hours * 3600) - (days * 86400)) / 60)
   30: Else
   31:  minutes = 0
   32: End If
   33:
   34: Seconds = Seconds - (minutes * 60) - (hours * 3600) - _
   35:    (days * 86400)
   36:
   37: If Seconds > 0 Then Result = Seconds & " second" & AutoS(Seconds)
   38:
   39: If minutes > 0 Then
   40:     bAddComma = Result <> ""
   41:
   42:     sTemp = minutes & " minute" & AutoS(minutes)
   43:     If bAddComma Then sTemp = sTemp & ", "
   44:     Result = sTemp & Result
   45: End If
   46:
   47: If hours > 0 Then
   48:     bAddComma = Result <> ""
   49:
   50:     sTemp = hours & " hour" & AutoS(hours)
   51:     If bAddComma Then sTemp = sTemp & ", "
   52:     Result = sTemp & Result
   53: End If
   54:
   55: If days > 0 Then
   56:     bAddComma = Result <> ""
   57:     sTemp = days & " day" & AutoS(days)
   58:     If bAddComma Then sTemp = sTemp & ", "
   59:     Result = sTemp & Result
   60: End If
   61:
   62: SecondsToText = Result
   63: End Function
   64:
   65:
   66: Function AutoS(Number)
   67:     If Number = 1 Then AutoS = "" Else AutoS = "s"
   68: End Function
   69:
The report can be executed directly by passing parameters in the URL as documented here https://msdn.microsoft.com/en-us/library/ms155391(v=SQL.100).aspx. This was useful to test the report execution. I used two parameters, an example of this URL structure is shown below:
&rs:Command=Render&pName=Test&pDate=11/01/2011
This can be achieved both in native and SharePoint integrated mode.
The fact that the OperationsManagerDW schema is documented has made the whole process of creating a custom report a lot easier and the flexibility of Reporting Services provides a better representation of the data to the end-user.


