BCL Refresher: System.Diagnostics.Debug class [Inbar Gazit]
Many people told me that they would like to see more blog entries. Not only about the new cool stuff that's coming but also about the old established stuff that's maybe a tad forgotten. So, with the BCL refresher series we're going to go back to talk about existing APIs that are useful and remind you just what you can do with the current BCL.
Debugging your application is one of the most time-consuming tasks developers have to master. More often than not developers are facing with tough hard-to-find bugs that require spending days or even weeks to track down. Sometimes using the debugger alone is not enough but code hooks are needed so that you can collect information about your application. This is where System.Diagnostics.Debug is useful.
The first thing to note about this class is that it's static and all its code will only be available in debug builds. So you should feel free to sprinkle your sources with Debug static method calls knowing that they will never appear in retail builds you give customers. (Note that that's when compiling with /D:DEBUG not when compiling with /debug which will not affect how we treat System.Diagnostics.Debug calls).
The most useful thing you can do with Debug is print messages to the debugger console. This will allow you to collect information about your application while it runs in the debugger. This information will be found in the Output window in Visual Studio while it's hooked to your application. If a debugger is not hooked to your application – the messages will be collected by Windows's DebugOutputStream. There are several different methods you can use to write to the debugging console:
- Debug.Write() – simply writes a message without any conditions or new line.
- Debug.WriteLine() – writes a message followed by a new-line separator.
- Debug.WriteIf() – writes a message if a certain condition is met without a new line.
- Debug.WriteLineIf – write a message if a certain condition is met followed by the new-line sperator.
- Debug.Print() – similar to Debug.WriteLine()
All of the above have different flavors (overloads) that can take either an object and call ToString() or a string or an additional category string etc. I find the first overload to be the most useful most of the times. It's also important to note that by default all of these will write to the OutputDebugString or the debugger console while hooked but that it's possible to hook other listeners to these messages just like with the System.Diagnostics.Trace class. To do that you need to change the <TraceListeners> section of the app.config file to define other listeners where you want these messages routed to. BTW, Microsoft has recently updated (for Vista) a tool to look at the OutputDebugString, you can find it here: https://www.microsoft.com/technet/sysinternals/utilities/debugview.mspx
OK, so you can have your application emit debugging messages to the console and/or your listeners and that's all nice and well, but what else can you do with the Debug class?
Well, it's also possible to use the Debug.Assert() method in your code to verify the correctness of your application. Debug.Assert will check a certain Boolean condition and if it fails – will pop-up a message. The message to the user looks like this (if the debugger is attached):
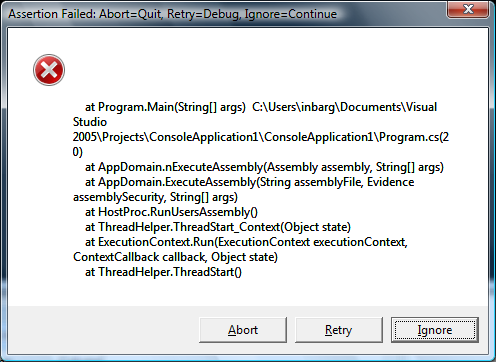
(If the debugger is not attached the message has less information, particularly the StackTrace is omitted).
At this point you (the developer) know something went wrong since your assertion failed (typically the Boolean condition should always be true and if it is not –something was not working the way you expected it to). You have 3 options: you can ignore the issue and continue execution from the next like by clicking "Ignore", you can Click "Abort" to halt execution and completely stop the application or you can step into the debugger by clicking "Retry" (which will not really retry). If the debugger is not attached at this point you would then get another Just-in-time debugger dialog asking you to choose the debugger you want to run.
Debug.Assert() has 2 additional overloads that allow you to specify one or 2 messages to the user about the condition/situation that you encountered. These would appear in the above dialog before the rest of the message. In the debugger console (or DebugOutputString) you will see something like this:
---- DEBUG ASSERTION FAILED ----
---- Assert Short Message ----
<Short message here>
---- Assert Long Message ----
<Long message here>
Followed by the same information as in the dialog above. This is useful for situations where you don't have a console or a person monitoring your application (as in some server situations) and you need the assert information. Again, this information will be sent to any TraceListeners you may have hooked at this point just like with Debug.Write().
If you need to always have a failing assertion you can either do Assert(false) or call the Debug.Fail() method which is there for just that purpose. It will be behaving just like an assertion that failed.
The Debug class has a few more methods and properties. Most of them deal with the listeners themselves (like Close, Flush, AutoFlush etc.). The Listeners collection is also there and is useful if you find it necessary to make runtime changes to the listeners as opposed to handling it through the app.config file.
Whether you are already using the Debug class or just heard of it for the first time I hope you will find this blog useful and that you will be trying out some of this stuff. I encourage you to play a little bit with Debug and let us know if you have any questions. Also, let us know if you think it's useful to do the BCL refresher series and what topics might interest you for future blog entries.