Query Fingerprints and Plan Fingerprints (The Best SQL 2008 Feature That You've Never Heard Of)
In versions of SQL Server before SQL Server 2008, it can be difficult to determine the cumulative cost of the queries running on a server if the workload includes unparameterized queries. The only truly reliable method is to capture a Profiler trace during a representative time period, then post-process the trace with a utility that strips out any inline literal values from the query text. A number of utilities have sprung up that use this general approach: ReadTrace, SQL Nexus/TraceBuster, and Bill Graziano’s ClearTrace utility are three that I know of. Trace-based query cost analysis is effective, but there are a number of big problems with this approach: capturing a batch- or statement-level profiler trace is expensive and sometimes can slow down your server, a trace can grow up to several GB per minute on servers that have a high transaction rate, and the capture and analysis of the data tends to be a time-consuming and labor-intensive process that is difficult to automate.
In SQL Server 2008, the SQL Server database engine has a powerful new feature that generates an identifier for each query. The identifier is independent of any inline parameter values, so it serves as a very effective query identifier. This identifier – sometimes called a “query fingerprint” – enables a fairly robust method of identifying the most expensive queries on your server based on nothing but DMV queries. I think the feature will eventually form the basis of a query cost analysis approach that requires a much smaller investment of DBA time, has greatly reduced risk, and scales to higher-volume workloads than a traditional trace-based analysis.
This is my personal favorite “sleeper feature” in SQL 2008; the query optimizer team deserves kudos for getting it done in time for the release, and for making it inexpensive enough that fingerprint generation can be on-by-default. It was a very late addition to the release, which I think is the main reason that fingerprints have generated relatively little buzz so far. Plan fingerprints are used to calculate query plan cost in the new Activity Monitor tool that you can launch by right-clicking a server in SQL Server 2008's Management Studio.
To fully appreciate query fingerprints’ value, you first must understand one of the limitations of the sys.dm_exec_query_stats Dynamic Management View (DMV) that was introduced in SQL Server 2005. This DMV lists every statement query plan that is in procedure cache at that moment, along with execution stats for the query plan such as the number of executions of the plan, total CPU cost, physical and logical reads, and so on. It was a groundbreaking addition to SQL Server because, for the first time, it allowed a DBA to examine the cost of the queries in a workload without capturing a Profiler trace. For certain workloads, the original sys.dm_exec_query_stats DMV provides a simple and powerful way to identify the most expensive queries: you capture two snapshots of the DMV, then you join the second snapshot back to the first to calculate the execution cost of each query plan in the time between the two snapshots. But the DMV also has some limitations that constrain its usefulness. In particular, if a query is not explicitly or implicitly parameterized and if the query text contains inline literal values, that query plan will not be reused. Every execution of the query with a different set of parameter values will generate a new compiled plan object. You can see this by running these queries:
-- Run "the same" query twice, but with a different inline parameter
-- value for each execution
GO
SELECT type FROM sys.objects WHERE name = 'sysfiles1'
GO
SELECT type FROM sys.objects WHERE name = 'sysprivs'
GO
-- Find the query execution statistics row(s) for the query
SELECT sql_handle, plan_handle, execution_count
FROM sys.dm_exec_query_stats AS qs
CROSS APPLY sys.dm_exec_sql_text (qs.plan_handle) AS sql
WHERE sql.text LIKE 'SELECT type FROM sys.objects WHERE name %'
GO
Here's the output:

The two queries that look like “SELECT type FROM sys.objects WHERE name = 'x'” are identical except for a different inline parameter value, but each query’s statistics are tracked in different rows in sys.dm_exec_query_stats. This happens because the query is not explicitly parameterized, and the different inline literal values cause SQL Server to compile a separate query plan each time the query is executed with a different parameter value. This behavior makes it difficult to use sys.dm_exec_query_stats to identify the true cumulative cost of a query. Suppose that this query was executed frequently enough to be the most expensive query on your server, but suppose that most executions had a different search parameter value. With the query’s cumulative cost spread out across thousands of rows in sys.dm_exec_query_stats, how would you recognize that each of those thousands of rows actually represents a fraction of the total execution cost of a single query? This is a key problem that the query fingerprint feature in SQL Server 2008 helps to address. To see how it works, add these queries to your query window, and then re-execute the entire script:
-- Execute a second query that is not quite the same shape as the prior query
GO
SELECT type FROM sys.objects WHERE name = 'sysprivs' AND create_date < GETDATE()
GO
-- Find the query execution statistics row(s) for the query
SELECT sql_handle, plan_handle, execution_count, query_hash, query_plan_hash
FROM sys.dm_exec_query_stats AS qs
CROSS APPLY sys.dm_exec_sql_text (qs.plan_handle) AS sql
WHERE sql.text LIKE 'SELECT type FROM sys.objects WHERE name %'
GO
When you re-run the script, you should see output like the following:
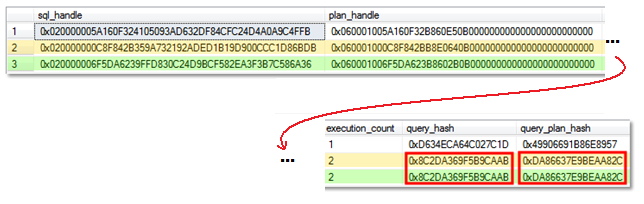
Note the query_hash and query_plan_hash columns that are new to sys.dm_exec_query_stats in SQL Server 2008. This is one of two places where the new SQL Server 2008 query fingerprint and query plan fingerprint features are exposed (the other is the sys.dm_exec_requests DMV). Note that the two queries we ran first have the same query_hash value, which indicates that if you were to strip out any inline literals, the two queries have the same “shape”. They also have the same query_plan_hash value, which means that even though they each had their own compiled plan object in the procedure cache, those two query plans also had the same general form. However, the second query doesn’t have quite the same “shape” as the first two queries; it includes an additional filter predicate (“create_date < GETDATE()”), and therefore has different query_hash and query_plan_hash values. Using these two new columns, we can combine the costs of all plans that have the same shape and calculate the true cumulative cost of all executions of a query. This approach generally works well even when faced with an unparameterized workload that features poor plan reuse.
Below I've provided some more detailed information about query fingerprints and query plan fingerprints. This information should be accurate as of the initial release of SQL Server 2008, but it is possible that some of the implementation details will change in subsequent releases. In order to protect the ability to improve the feature, we’re not providing an iron-clad guarantee that a query’s fingerprint won’t change across SQL versions, although we recognize the value of an identifier that remains constant across releases and plan to avoid changes to the fingerprint calculation algorithms unless there’s a very good reason to change them.
Query Fingerprints
A query fingerprint is also called a “query hash”. The queries below are all similar enough to have the same query fingerprint:
SELECT * FROM foo WHERE column1 = 'A' AND column2 = 'B'
SELECT * FROM foo WHERE column1 = 'X' AND column2 = 'Y'
SELECT * FROM foo WHERE column1 = 100 AND column2 = 200
SELECT * FROM foo WHERE foo.column1 = 'X' AND foo.column2 = 'Y'
On the other hand, all of the queries below are have differences that are significant enough to produce different query fingerprints:
SELECT * FROM foo WHERE column1 = 'X'
SELECT * FROM foo AS foo2 WHERE column1 = 'X' AND column2 = 'Y'
SELECT * FROM foo WHERE column1 = 'X' AND column2 IS NULL
SELECT * FROM foo WHERE column1 = 'X' OR column2 = 'Y'
SELECT column1 FROM foo WHERE column1 = 'X' AND column2 > 'Y'
Here are some facts that help clarify how query fingerprints are generated:
- Query fingerprints are generated from a tree of logical operators that is used as an input to the query optimizer. Because this tree is created prior to query optimization, a query fingerprint is influenced only by the query’s text, not by the query plan. In other words, two queries may have the same query fingerprint but use two very different query plans.
- Similarly, because the query fingerprint is generated from an operator tree *after* parsing, two queries don't have to have the exact same text to have the same fingerprint. Whitespace and comments don't matter, and the queries can even have some small, semantically-irrelevant differences.
- Query fingerprints are not affected by the current database context or by the current instance name. This means that the same query run within two different databases, or even two different SQL Server instances, will generally have the same query fingerprint value.
- The table, view, and function names referenced by two queries must be identical for the queries to have the same fingerprint. This includes table aliases; if two queries are identical except that one of them uses a table alias and the other query refers to the table using its actual name, the two queries will not have the same fingerprint.
- If a query has any table or query hints (including any hints applied via a plan guide), the hints must be identical in order to generate the same query fingerprint.
- SET options may influence query fingerprints if they change the query semantics. For example, the logical meaning of a predicate like “column1 = NULL” is influenced by the current ANSI_NULLS setting. If the query includes a predicate like this, then changing the ANSI_NULLS setting may generate a different query fingerprint.
Plan Fingerprints
A query plan fingerprint may also be referred to as a “plan hash”. Plan fingerprints are generated from the tree of physical operators that makes up a compiled query execution plan. Generally speaking, if a user would consider two plans to be different, they will have different plan fingerprint values.
In order to have the same plan fingerprint value, the trees of operators that make up the plans must have the same shape. For each physical operator in one plan, the corresponding node in the other plan must be the same physical operator. For example, if two plans have the same general shape but one plan includes a Hash Join operator where the second plan uses a Loop Join, the two plans will not have the same plan fingerprint.
Certain operator attributes must also be identical in order to generate a matching plan fingerprint. For example, two Table Scan operator must reference the same table name, or they will not match. However, not every attribute of an operator is included in the query plan hash value. For example, the specific number of rows that is estimated to be returned from a Table Scan operator does not influence the plan fingerprint. Two cached plans may have slightly different estimated row counts, yet have the exact same shape and the same execution characteristics, and therefore the same plan fingerprint.
Like query fingerprints, a plan fingerprint is not affected by database context or SQL Server instance name, so if similarly-shaped query plans are used in two different databases, the plans will receive the same plan fingerprint. Plan fingerprints are sensitive to object names, but an exception exists for automatically-generated primary key and unique key constraints. (Unfortunately, due to an issue in the initial release of SQL Server 2008, a query that references a local temporary table will generate different plan and query fingerprints for each execution. Hopefully, this will be addressed in a subsequent Cumulative Update or Service Pack release.)
Finally, in the initial implementation of the plan fingerprint feature, a statement’s query fingerprint value is included in the plan hash. In other words, two different queries with different query fingerprints may result in the “same” plan, but the plan fingerprints will be different simply because the query fingerprints are different.
Limitations
Here are some of the more important restrictions that you should be aware of:
- In SQL 2008, the query and plan fingerprints are still tied to the sys.dm_exec_query_stats DMV, which means that the aggregate stats for a fingerprint are associated with cached query plans. Query plans have a transient lifetime, and may be removed at any time in response to internal or external memory pressure on the procedure cache. Any query statistics that are inserted and removed in the interval between two queries against the DMV will not be reflected in your query cost estimates (you can partially compensate for this by querying the DMV at a more frequent interval). Also, certain types of query plan are never inserted into the procedure cache (one example is the plan for a CREATE INDEX). Execution statistics for these types of queries may be undercounted.
- The sys.dm_exec_query_stats DMV only shows statistics for completed query executions. In-progress, long-running queries will not show up in the DMV until they finish running. You can merge the stats from this DMV with the the sys.dm_exec_requests DMV (which also exposes the new fingerprint columns) in order to get a more complete view.
- Using fingerprints to determine cumulative query cost relies on using the new query_hash and query_plan_hash columns as keys that uniquely identify a particular query’s or plan’s “shape”. It is possible, though unlikely, that two different queries may end up with the same hash value, causing statistics for both of the queries to be charged to one of them. It is also possible that two variations of the “same” query may be assigned different fingerprint hash values, in which case the cost of the query may appear to be spread out over several buckets, making it difficult to recognize the query’s true cumulative cost. At the time of the initial release of SQL Server 2008, we’ve only encountered one instance of this: different executions of a query that references a temp table may be assigned different query_hash values. This problem with temp tables isn’t intentional; it’s a bug, and I’m hopeful that it will be fixed in an upcoming Service Pack or Cumulative Update.
Future Plans
I already mentioned the new SQL 2008 Activity Monitor, which uses plan fingerprints to generate more accurate estimates of query cost than would otherwise be possible. Looking forward, we have plans to publish a new custom collection set based on the SQL Server 2008 Data Collector that uses plan fingerprints to provide a Top N Query identification tool. You will be able to use this new “Query Hash Statistics” collection set as-is, or customize it to meet your needs. The documentation that accompanies this collection set will include a subset of the info in this post, so if you’ve read to this point, you’ll be able to skim over some of the collection set docs. (Update: Query Hash Statistics has shipped.)
I suspect that it won’t be terribly long before your favorite SQL monitoring tool starts to take advantage of this feature, but if you’re of the roll-your-own bent, you can start creating your own custom query analysis scripts right now using the info provided here. Below I've provided a query to get you started. It groups on query_plan_hash to calculate query statistics for all plans with a given plan fingerprint, and pulls the statement text from a representative cached plan object that has a given fingerprint.
SELECT TOP 100
query_hash, query_plan_hash,
cached_plan_object_count,
execution_count,
total_cpu_time_ms, total_elapsed_time_ms,
total_logical_reads, total_logical_writes, total_physical_reads,
sample_database_name, sample_object_name,
sample_statement_text
FROM
(
SELECT
query_hash, query_plan_hash,
COUNT (*) AS cached_plan_object_count,
MAX (plan_handle) AS sample_plan_handle,
SUM (execution_count) AS execution_count,
SUM (total_worker_time)/1000 AS total_cpu_time_ms,
SUM (total_elapsed_time)/1000 AS total_elapsed_time_ms,
SUM (total_logical_reads) AS total_logical_reads,
SUM (total_logical_writes) AS total_logical_writes,
SUM (total_physical_reads) AS total_physical_reads
FROM sys.dm_exec_query_stats
GROUP BY query_hash, query_plan_hash
) AS plan_hash_stats
CROSS APPLY
(
SELECT TOP 1
qs.sql_handle AS sample_sql_handle,
qs.statement_start_offset AS sample_statement_start_offset,
qs.statement_end_offset AS sample_statement_end_offset,
CASE
WHEN [database_id].value = 32768 THEN 'ResourceDb'
ELSE DB_NAME (CONVERT (int, [database_id].value))
END AS sample_database_name,
OBJECT_NAME (CONVERT (int, [object_id].value), CONVERT (int, [database_id].value)) AS sample_object_name,
SUBSTRING (
sql.[text],
(qs.statement_start_offset/2) + 1,
(
(
CASE qs.statement_end_offset
WHEN -1 THEN DATALENGTH(sql.[text])
WHEN 0 THEN DATALENGTH(sql.[text])
ELSE qs.statement_end_offset
END
- qs.statement_start_offset
)/2
) + 1
) AS sample_statement_text
FROM sys.dm_exec_sql_text(plan_hash_stats.sample_plan_handle) AS sql
INNER JOIN sys.dm_exec_query_stats AS qs ON qs.plan_handle = plan_hash_stats.sample_plan_handle
CROSS APPLY sys.dm_exec_plan_attributes (plan_hash_stats.sample_plan_handle) AS [object_id]
CROSS APPLY sys.dm_exec_plan_attributes (plan_hash_stats.sample_plan_handle) AS [database_id]
WHERE [object_id].attribute = 'objectid'
AND [database_id].attribute = 'dbid'
) AS sample_query_text
ORDER BY total_cpu_time_ms DESC;