IE8 developer toolbar: A step forward to measure RIA performance, a case study
With the new wave of RIA, the applications are relying more on JavaScript for the rich user experience. The two key factors which influence the performance a.k.a end user experience are: JavaScript and the Client Processing Speed. With a standard client processor, it is not very uncommon to find plateau of high CPU utilization on the client side for inefficient JavaScript rendering logic.
To measure the time taken by JavaScript code at the client was a pain. Sometimes we used a tool, AjaxView, but it has it's own limitations (e.g. doesn't work with HTTPS, separately run a proxy and change the browser proxy etc.). In couple of my engagements where the site uses HTTPS , I preferred an age old method: counting the ticks from my wrist watch till the JavaScript rendering ends. But, with the arrival of IE8 developer tool, my life is too cool now form this perspective. I can profile, measure and support my findings with something solid on black and white. There is a good article from MSDN which talks about it.
For one of our customers we did the performance analysis of their website. Historically, whenever users click on a button on a particular page the CPU utilization at the client side reaches 100% and stays there for almost 2/3 minutes before users could do anything. On investigation we found two areas of improvement:
- JavaScript
- Network transfer
After sometime they claimed some of the issues had been fixed and the response time was improved. Though there were some improvements on the overall response time due to logic change in the network transfer, they did little to fix the JavaScript issue. To substantiate my claim I used Developers Tool of IE8 Beta2.
The following steps I followed:
- Open the website, go to the page where you suspect the event is present.
- Just before clicking on the problematic button(the scenario) launch Developer Tool (press F12),
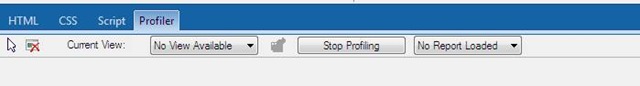
- From the Profiler Tab Start Profiling.
![clip_image002[6]](https://msdntnarchive.blob.core.windows.net/media/TNBlogsFS/BlogFileStorage/blogs_msdn/banibrata_de/WindowsLiveWriter/IE8toolbarAstepforwardtomeasureRIAperfor_FC4F/clip_image002%5B6%5D.jpg)
4. Wait till the page load finishes then Stop Profiling.
Finally a very cool table as below was generated, which can be exported to an excel file. Here I looked for functions with higher Exclusive Time, (Inclusive Time contains other timings spent inside(in case a function calling other functions, etc.))
In my case I found this:
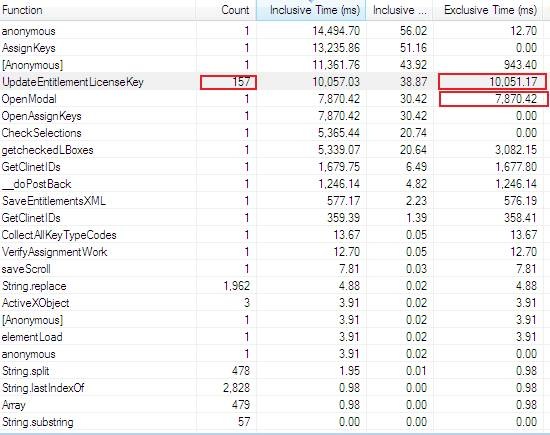
It indicates the JavaScript hotspots as the highlighted functions: UpdateEntitlementLicenseKey (executed 157 times) and OpenModal, overall it is consuming 17 seconds at the client machine. Moreover, during this transaction the CPU utilization reached 100% and stayed there for quite sometime.The time reported here is based on my PC's hardware configuration, it could vary depending on the hardware configuration of the client machine.
So, now I have a reason to go back to the developers and show them where the performance improvement is needed. Also developers can leverage the functionality of this cool profiler to identify the hotspots at the early stages of the development lifecycle to ensure end users' happiness.