Process Explorer to the rescue
Monday was a day to forget. I arrived at the office around 8:30 am, started my machine (like always), inserted my credentials, the desktop shows up and suddenly it gets unresponsive. First thing I do is CTRL+ALT+DEL, start Task Manager and it also gets hanged. The only commands that were responsive was log off and switch user (very useful right? J ).
My first mistake was not to use the same approach I always use in customers (do what I say not what I do J ) and started trying the try…error approach. The only thing this did was to waste my time with successive reboots, remove profile, add profile and other stuff. In my machine I have two profiles: the local admin one and another that I use to connect to Microsoft. The problems were in this second profile. The first one worked without any problems.
So I decided to stop for a minute and follow the typical methodology I always follow. So since my suspicions were on a driver or some program I had installed over the weekend (beta versions, don´t get me wrong I love beta versions because I believe they are a great way to help products getting better and better).
Since Switch User was working, the first step was to reproduce the problem. So I logged in with the profile that was having problems and then I switched to my local admin account. Then I started Process Explorer (aka ProcExp, you can download it from https://technet.microsoft.com/en-us/sysinternals/bb896653.aspx ). If you don´t know this tool, you can think of it as task manager on steroids and is a very valuable troubleshooting tool.
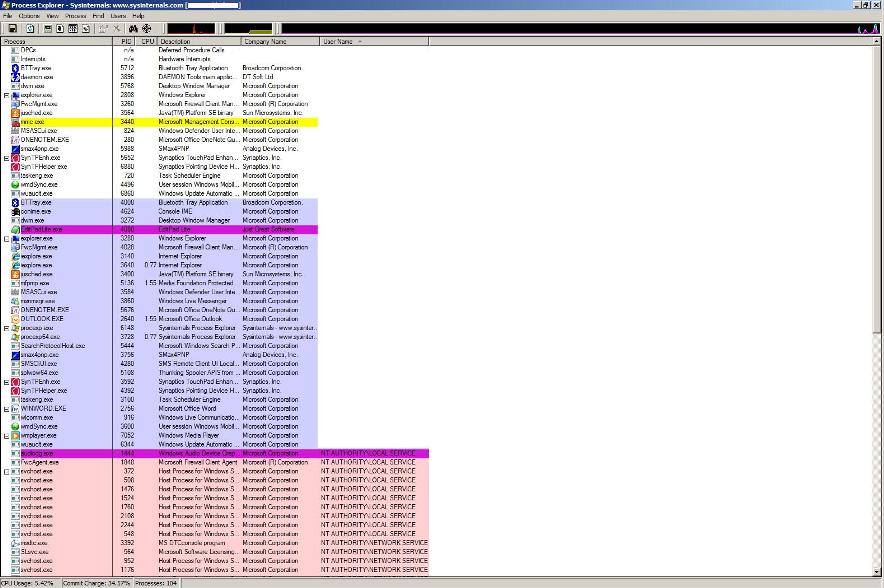
After opening ProcExp you will see a list of all processes running on your system and also the account that started the process (this allowed me to see processes that were running in my problematic profile).
To see the username, you have to right click on one of the columns and “Select Columns” > “Username”. Then if you click order by Username, you will notice that each group will have a different color. You can see this in the image below (i´ve removed the usernames from my machine, that´s why you see a blank column under Username)

Process Explorer allows you to see threads and call stacks for each process, so my approach was to look at processes that were executing under DOMAIN\USER and dig into each one of them trying to find strange behaviors. You might ask, what is a strange behavior? I would say, it depends (wow, I’ve never heard that answer before). In my case I decided to start looking at processes that were consuming more CPU and those with names that I was not familiar with.
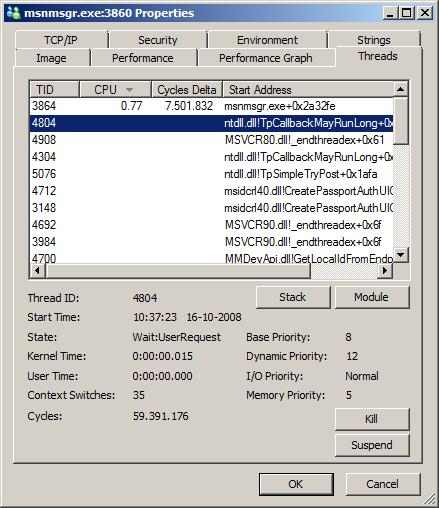
So how do you look at threads and call stacks? Right click on a process and select Properties. Inside Properties you have a tab called Threads. Click on it.

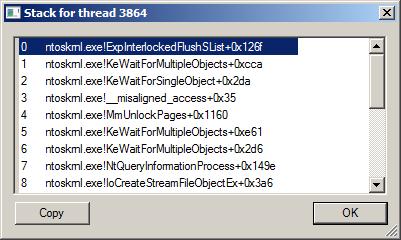
Here you can try to identify some thread that does not look good, or it might be that they are all hang (these are just some examples, and the more experience you have the easier it would be for you) . Let´s imagine I had one thread that was consuming almost all CPU and then i could look at the stack (select your thread and click on STACK)

So I did this for a couple of processes until I identified the bad boy. Then I disabled it, switched user and “voilá” all my problems were gone (and part of my working day).
Paulo, after all it was not the beta version you gave me that got me into troubles J
Happy debugging!!!
Bruno