Ask Learn
Preview
Ask Learn is an AI assistant that can answer questions, clarify concepts, and define terms using trusted Microsoft documentation.
Please sign in to use Ask Learn.
Sign inThis browser is no longer supported.
Upgrade to Microsoft Edge to take advantage of the latest features, security updates, and technical support.
Note
Access to this page requires authorization. You can try signing in or changing directories.
Access to this page requires authorization. You can try changing directories.
Slow application performance issues tend to be challenging to troubleshoot regardless of the platform in which your application is running. This is due in great part to the sometimes random nature of these issues. These types of issues also often do not result in a specific error being logged.
If you think your node.js application is running slow and takes more than few seconds to receive response. Below info may help you analyze where it's taking longer time and also checks for memory leaks. There are many node.js modules to accomplish this(notably)
If you analyze below sample code, I have included memory leak highlighted in Red and CPU intensive work in Amber colors.
 /**
 * Created by prmadi on 8/20/2015.
 */

 var http = require('http');
 var port = process.env.PORT || '3000';

 // Memory Leak
 function LeakingClass() {
 }
 var leaks = [];
 setInterval(function() {
 for (var i = 0; i < 100; i++) {
 leaks.push(new LeakingClass);
 }
 console.error('Leaks: %d', leaks.length);
 }, 1000);

 http.createServer(function (req, res) {

 // CPU intensive work
 var fibonacci = function(n){
 if(n < 1){return 0;}
 else if(n == 1 || n == 2){return 1;}
 else if(n > 2){return fibonacci(n - 1) + fibonacci(n-2);}
 };
 fibonacci(40);

 res.writeHead(200, {'Content-Type': 'text/plain'});
 res.end('Hello World\n'+ fibonaccif(40));
 }).listen(port, '127.0.0.1');
I would show you how to use v8-profiler on above sample code to find memory leaks and CPU Usage. More info on v8-profiler can be found @ https://github.com/node-inspector/v8-profiler
npm install v8-profiler
  var fs = require('fs'),
 ws = fs.createWriteStream('debugdump/'+Date.now() + '.heapsnapshot'),
 profiler = require('v8-profiler'),
 snapshot = profiler.takeSnapshot(),
 callback = ws.end.bind(ws);

 snapshot.serialize(function(data) {
 ws.write('' + data);
 }, callback);//begin cpu profiling
  profiler.startProfiling();

 // code to be profiled here

 var cpuProfile = profiler.stopProfiling();
 var serialized = JSON.stringify(cpuProfile, null, 2);
 fs.writeFileSync('debugdump/'+Date.now() +'.cpuprofile', serialized, 'utf8');
Here is my sample code after adding profiler instructions listed above
 /**
 * Created by prmadi on 8/20/2015.
 */

 var http = require('http');
 var port = process.env.PORT || '3000';

 function LeakingClass() {
 }
 var leaks = [];
 setInterval(function() {
 for (var i = 0; i < 100; i++) {
 leaks.push(new LeakingClass);
 }
 }, 1000);

 http.createServer(function (req, res) {

 var fs = require('fs'),
 ws = fs.createWriteStream('debugdump/'+Date.now() + '.heapsnapshot'),
 profiler = require('v8-profiler'),
 snapshot = profiler.takeSnapshot(),
 callback = ws.end.bind(ws);

 snapshot.serialize(function(data) {
 ws.write('' + data);
 }, callback);//begin cpu profiling

 var fibonacci = function(n){
 if(n < 1){return 0;}
 else if(n == 1 || n == 2){return 1;}
 else if(n > 2){return fibonacci(n - 1) + fibonacci(n-2);}
 };

 profiler.startProfiling();

 fibonacci(40);

 var cpuProfile = profiler.stopProfiling();
 var serialized = JSON.stringify(cpuProfile, null, 2);
 fs.writeFileSync('debugdump/'+Date.now() +'.cpuprofile', serialized, 'utf8');

 res.writeHead(200, {'Content-Type': 'text/plain'});
 res.end('Hello World\n'+ fibonacci(40));
 }).listen(port, '127.0.0.1');
- Above code has created few CPU profiles and heap snapshots in my debugdump folder as in below screenshot.

- Load these files into chrome developer tools by selecting chrome developer tools > profiles > load
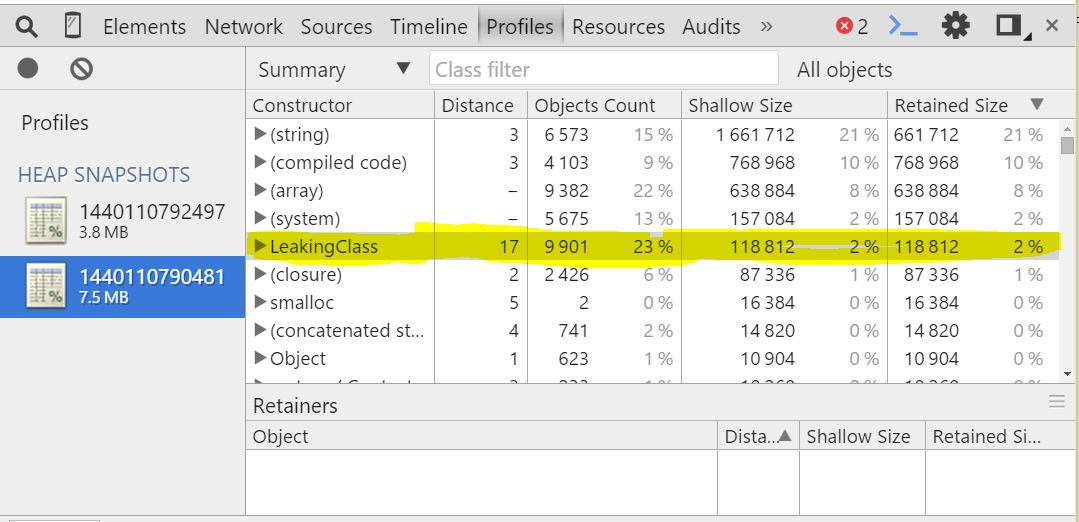
- Below is a sample heap snapshot analysis screenshots. As you can see, Leakclass was the culprit in my above sample code which is visible in heap snapshot.
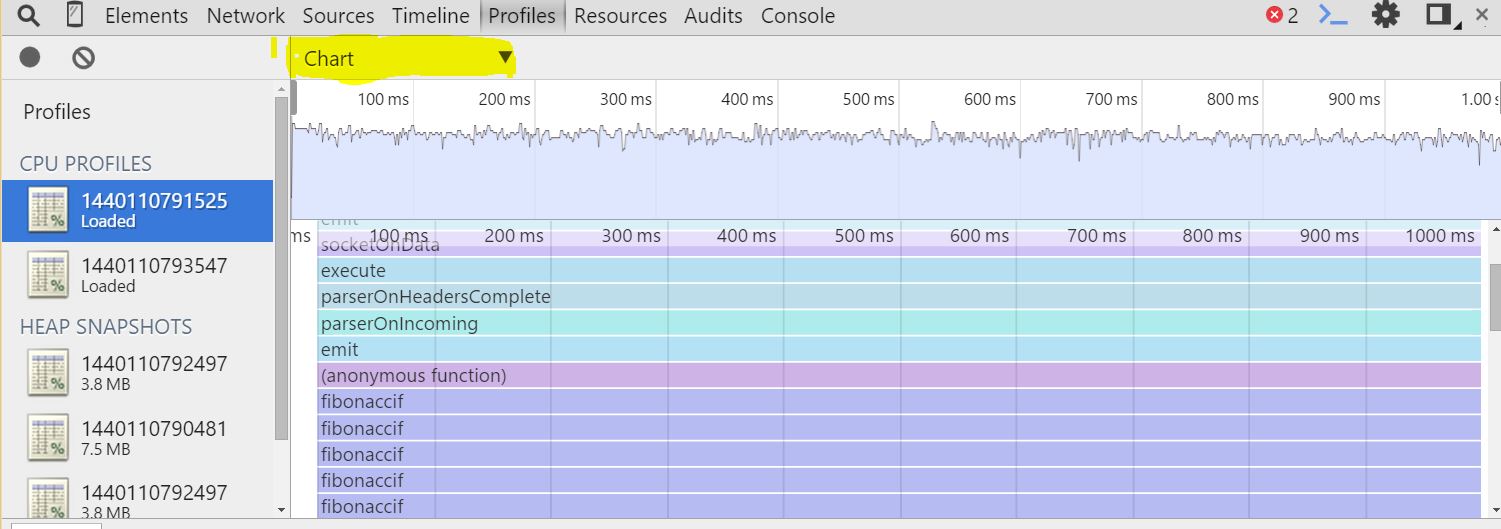
- Below is a sample CPU Usage analysis. As you can see, calculating fibonanci number was CPU intensive operation in my request which is visible in CPU profile.
Chart View :
Heavy (Bottom Up) View :

Anonymous
October 19, 2015
This is actually the first decent info I have found on the topic, but it leaves out one little bit that seems important for those of us not on the Windows platform (which is everyone at my company): How do I create a folder in the webapp? It seems as if you hint at doing it outside of the app, otherwise I am sure we could use some kind of file system call from the Node process.
The other thing is how to retrieve those files again using the azure CLI tools.
Anonymous
January 10, 2016
Hi Carl,Are you planning to create this folder manually using ftp/kudu console (https://Your_Website_name.scm.azurewebsites.net/DebugConsole).If you want create it using node.js mkdrip(https://www.npmjs.com/package/mkdirp) is something i generally use but there are many other too.
Ask Learn is an AI assistant that can answer questions, clarify concepts, and define terms using trusted Microsoft documentation.
Please sign in to use Ask Learn.
Sign in