Debugging .NET Backend in Visual Studio
It’s good to be back blogging! We have been busy working on Azure Mobile Services and as you may have seen we have just released a preview of the .NET backend. This means that you can now write your mobile application backend using ASP.NET Web API from Visual Studio using all the nice frameworks your love such as Autofac, AutoMapper, Entity Framework, Mongo, Azure Storage, and much more.
For news and updates, you can also follow me on twitter (@frystyk) as well as look for everything #AzureMobile. For questions, feel free to check out StackOverflow and our MSDN forum.
We’ll be publishing blogs describing how things work, look at codez, and much more, but today we’ll start with what to do when things don’t work and you need to debug to see what’s going on.
Prerequisites
We assume you have the latest Visual Studio 2013 Update 3 which has built in support for debugging an Azure Mobile Service. If you don’t have it already, then I would strongly encourage you to get.
We assume that you have created a Mobile Service with a .NET backend from the Azure portal, downloaded the TodoItem starter project, and opened it in Visual Studio 2013 Update 3. If you are new to this then check out the details in this blog.
Deploying Debug Build
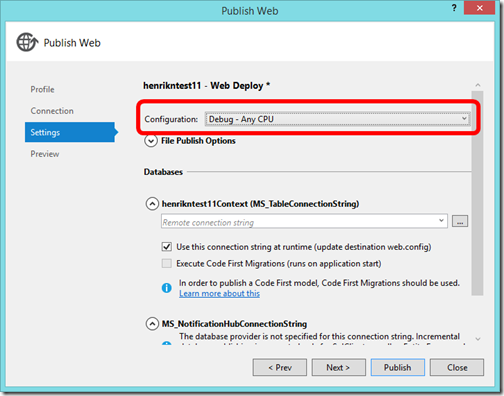
By default the Visual Studio Publishing Wizard uploads a Release build of your service which can make debugging some things harder due to the code having been optimized. However, you can ask the wizard to publish a Debug build instead under Settings – it should look like this:
Attaching Debugger
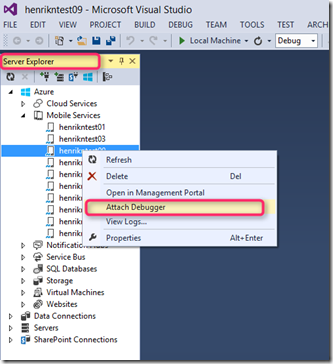
With Visual Studio Update 3, attaching the debugger to a service is super easy. Just find your Azure Mobile Service in the Service Explorer under the Azure tab, right click on the service you want to debug and select Attach Debugger. It should look like this:
That’s all! It will take a few minutes to get started as VS downloads symbols and the like, but now you should be ready to go.
Setting a Breakpoint
Breakpoints work exactly as when you debug locally so let’s try it out. Open the SampleJob scheduled job class in your solution and set a breakpoint in the ExecuteAsync method.
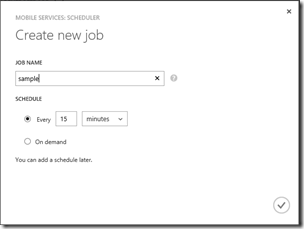
Go to the portal and select the Scheduler tab, the Create to create a new job and enter Sample (without the “job” at the end). It should look something like this:
Now, select Run Once and see the breakpoint get hit.
Load Backend Source and Symbols
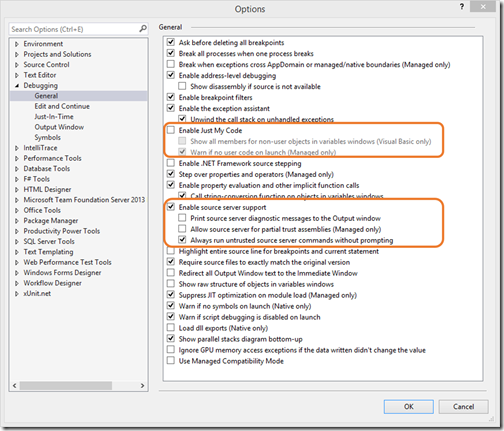
Now, if you want to debug through the backend code itself, you can also do this (this also works when debugging locally). First, you need to set up Visual Studio to find the source and symbols by going to Debug and then Options and Settings. Set the options like this:
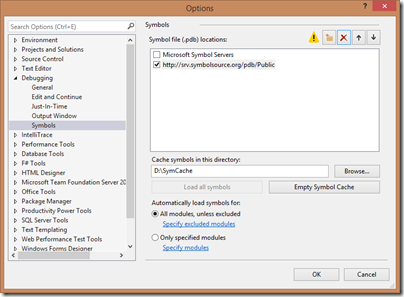
Finally, add a link to symbolsource.org for downloading the source and symbols. Go to the Symbols tab of the menu above and add https://srv.symbolsource.org/pdb/Public as a symbol location like this:
Note: Make sure the cache directory has a short name – otherwise the file names can get too long. Something like c:\SymCache works fine.
Now, when you are debugging you can jump into the backend code and see exactly what is going on.
Have fun!
Henrik
