Monitoring Azure Resources – Tools and Technology
As you think about building applications in Azure, or migrating VMs to Azure, one of the common first thoughts you might have is ‘How do my monitoring activities change once I’ve moved to Azure?’. I get this question (or a variation thereof) quite often when meeting with my customers, so I thought it would be a good idea to dig a bit deeper and provide some details around what tools are available to you.
Monitoring encompasses several different, but related topics. Have you ever had any of the following questions about your infrastructure?
- How is my application performing?
- Is my application online and running now?
- Will I get alerts when things stop working?
- Who made that change to my service?
- Has someone been attempting an attack on my infrastructure?
- What is causing my application to slow down?
- Are those packets arriving or being dropped?
- Am I reaching my networking limits in my subscription?
- …and many more
As you’ll see, Azure provides tools to answer all of these questions, and depending on what you are deploying in Azure, you can also bring many of your own tools. Let’s take a look at what’s available. Note: this post is rather long, but in this case, that’s a good thing!
In the following post, I’ll introduce and provide links for the following monitoring tools:
- Azure Monitor
- Network Watcher
- Application Insights
- Log Analytics
- Security Center
- Azure Log Integration
Azure Monitor

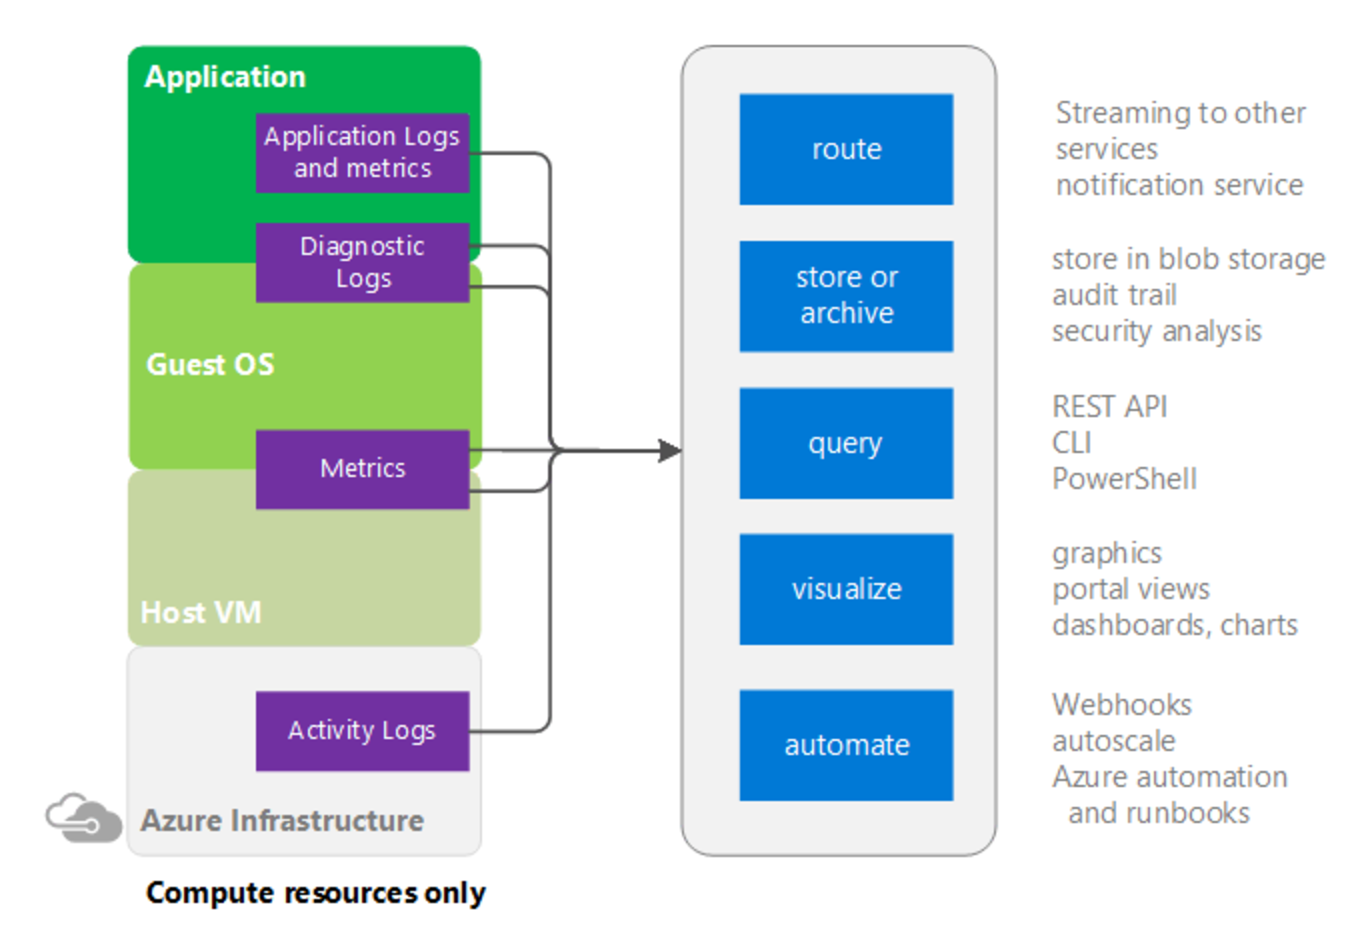
Perhaps the best place to start is with the tool Azure Monitor. This tool can be thought of as a PaaS monitoring tool that is available to use against all services in Azure using the Azure management portal. The graphic below depicts the sources of monitoring data on the left in the purple boxes, and what can be done with this data on the right in the blue boxes. There are different levels of monitoring depending on weather you are monitoring IaaS or PaaS services. Note that data collected can be routed to other Azure services, stored in Azure blob storage, queried, visualized, or be used to kick off some type of automation using webhooks.
Activity Logs
A fundamental collection source is activity logs, which are logs specific to Azure platform level objects, which come from the control plane. For example, an activity log will capture activities to answers questions such as ‘Who stopped that virtual machine?’, ‘Is there an outage in US West?’, or ‘When did my App Service scale up and scale down automatically?’. The activity log will contain a significant number of log entries over time and is therefore searchable based on subscription, resource group, resource type, operation type, and timespan (among others). Activity logs are turned on and retain data for 90 days by default. Learn more about activity logs here.
Diagnostics Logs
In addition to activity logs, Azure Monitor provides us with diagnostic logs. Diagnostic logs operate at both a resource-level and guest OS-level. Resource-level diagnostics capture resource specific data from the Azure platform (PaaS), while OS-level diagnostics capture data from the VM, operating system, and applications running within (IaaS). Think of resource-level diagnostics as logs that help you understand what operations occurred within a resource at the platform level. The available options differ based on the resource you have chosen. For example, with a recovery services vault, you can choose to get diagnostics logs for Backup reports, Site Recovery Jobs, or Site Recovery Events, to name a few. With OS-level diagnostics you can be very specific on what you choose to capture per VM. For example, you can choose basic performance counters, or get more specific by perusing the countless counters available in the custom settings. You can also choose which logs you want to capture weather it be application logs, IIS logs, event tracing logs, etc.—you get to choose how much you want to capture. You can also capture crash dumps or send data to application insights (discussed below).
Diagnostics logs are not turned on by default, you will choose per PaaS object or IaaS VM what you want to monitor. Of course, you can always use templates or scripts to define these settings for all future deployments. Learn more about diagnostics logs here. Keep in mind that with VMs, you can also continue monitoring the guest level events using tools that you’ve used on-premises.
Metrics
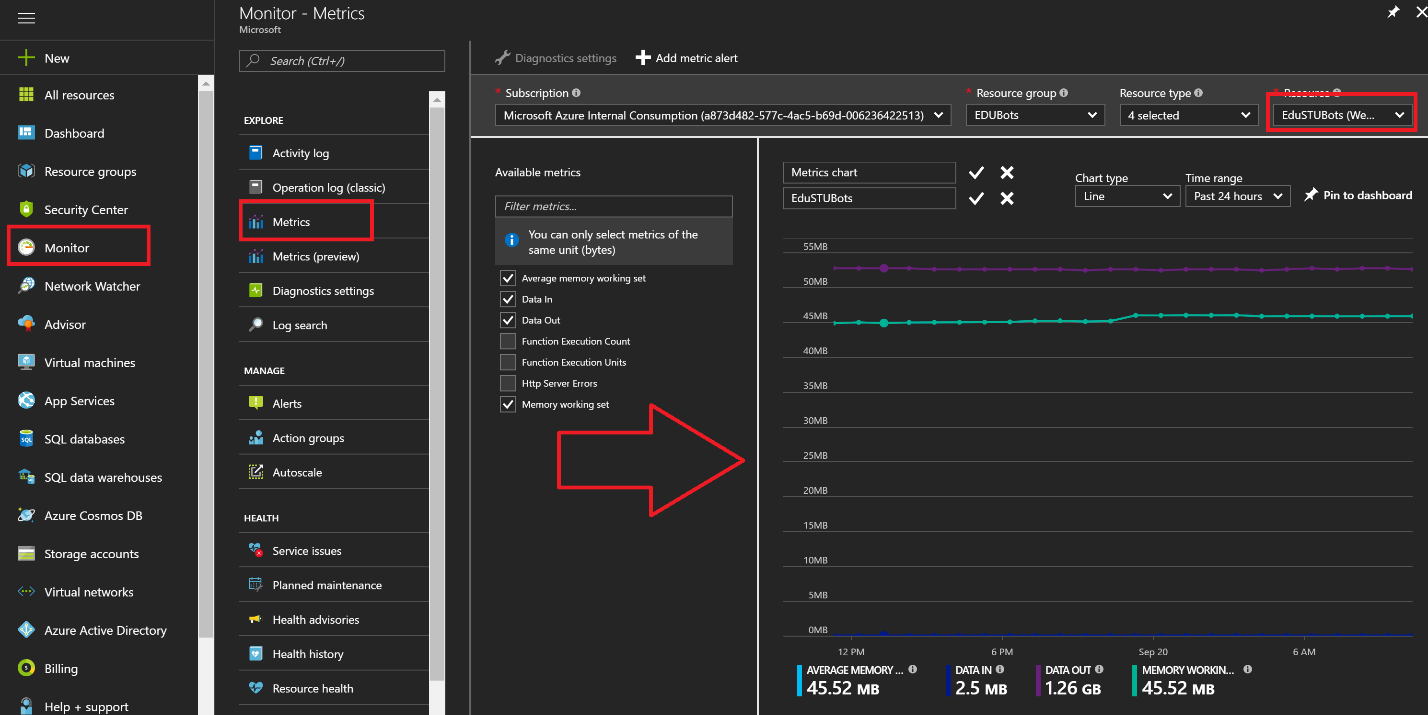
Metrics are provided by Azure Monitor to get telemetry and visibility into the performance and health of your workloads on Azure. These metrics are available for nearly all Azure resources including both PaaS and IaaS offerings. Metrics are on by default at the resource-level, which includes virtual machines. For virtual machines, this means host level telemetry is available by default. If you want to dig deeper into the metrics of the operating system and applications, then turning on diagnostics for a VM will expose these metrics to Azure Monitor for building dashboards, getting alerts, and taking action on these metrics. In the graphic below, I have used Azure Monitor Metrics to define a metrics chart for a webapp, which I later pinned to my dashboard. Read more about Metrics here.
Alerts
You can use Azure Monitor Alerts to take trigger-based actions on events that occur in activity logs or through metrics. For example, if I want to be alerted when a VM’s CPU sustains greater than 90% usage (Guest metrics) for 15 minutes, I can easily configure an alert. On the other hand, if I want to know if a VM is turned on (activity log), I can also be alerted to this activity. There are numerous scenarios that you’ll want to investigate. Once an alert is triggered, I can send emails, txt messages, trigger webhooks, or even run Azure Automation runbooks. Learn more about alerts here.
Azure Network Watcher
Azure Network Watcher provides many capabilities that will benefit you as you deploy and manage your Azure infrastructure. As you can see in the graphic below, Network Watcher is another tool, just like Azure Monitor, which is provided without you having to deploy anything, you simply have to enable it. Think of this tool as a network monitoring technology provided as a service.

Network Watcher provides several important capabilities including:
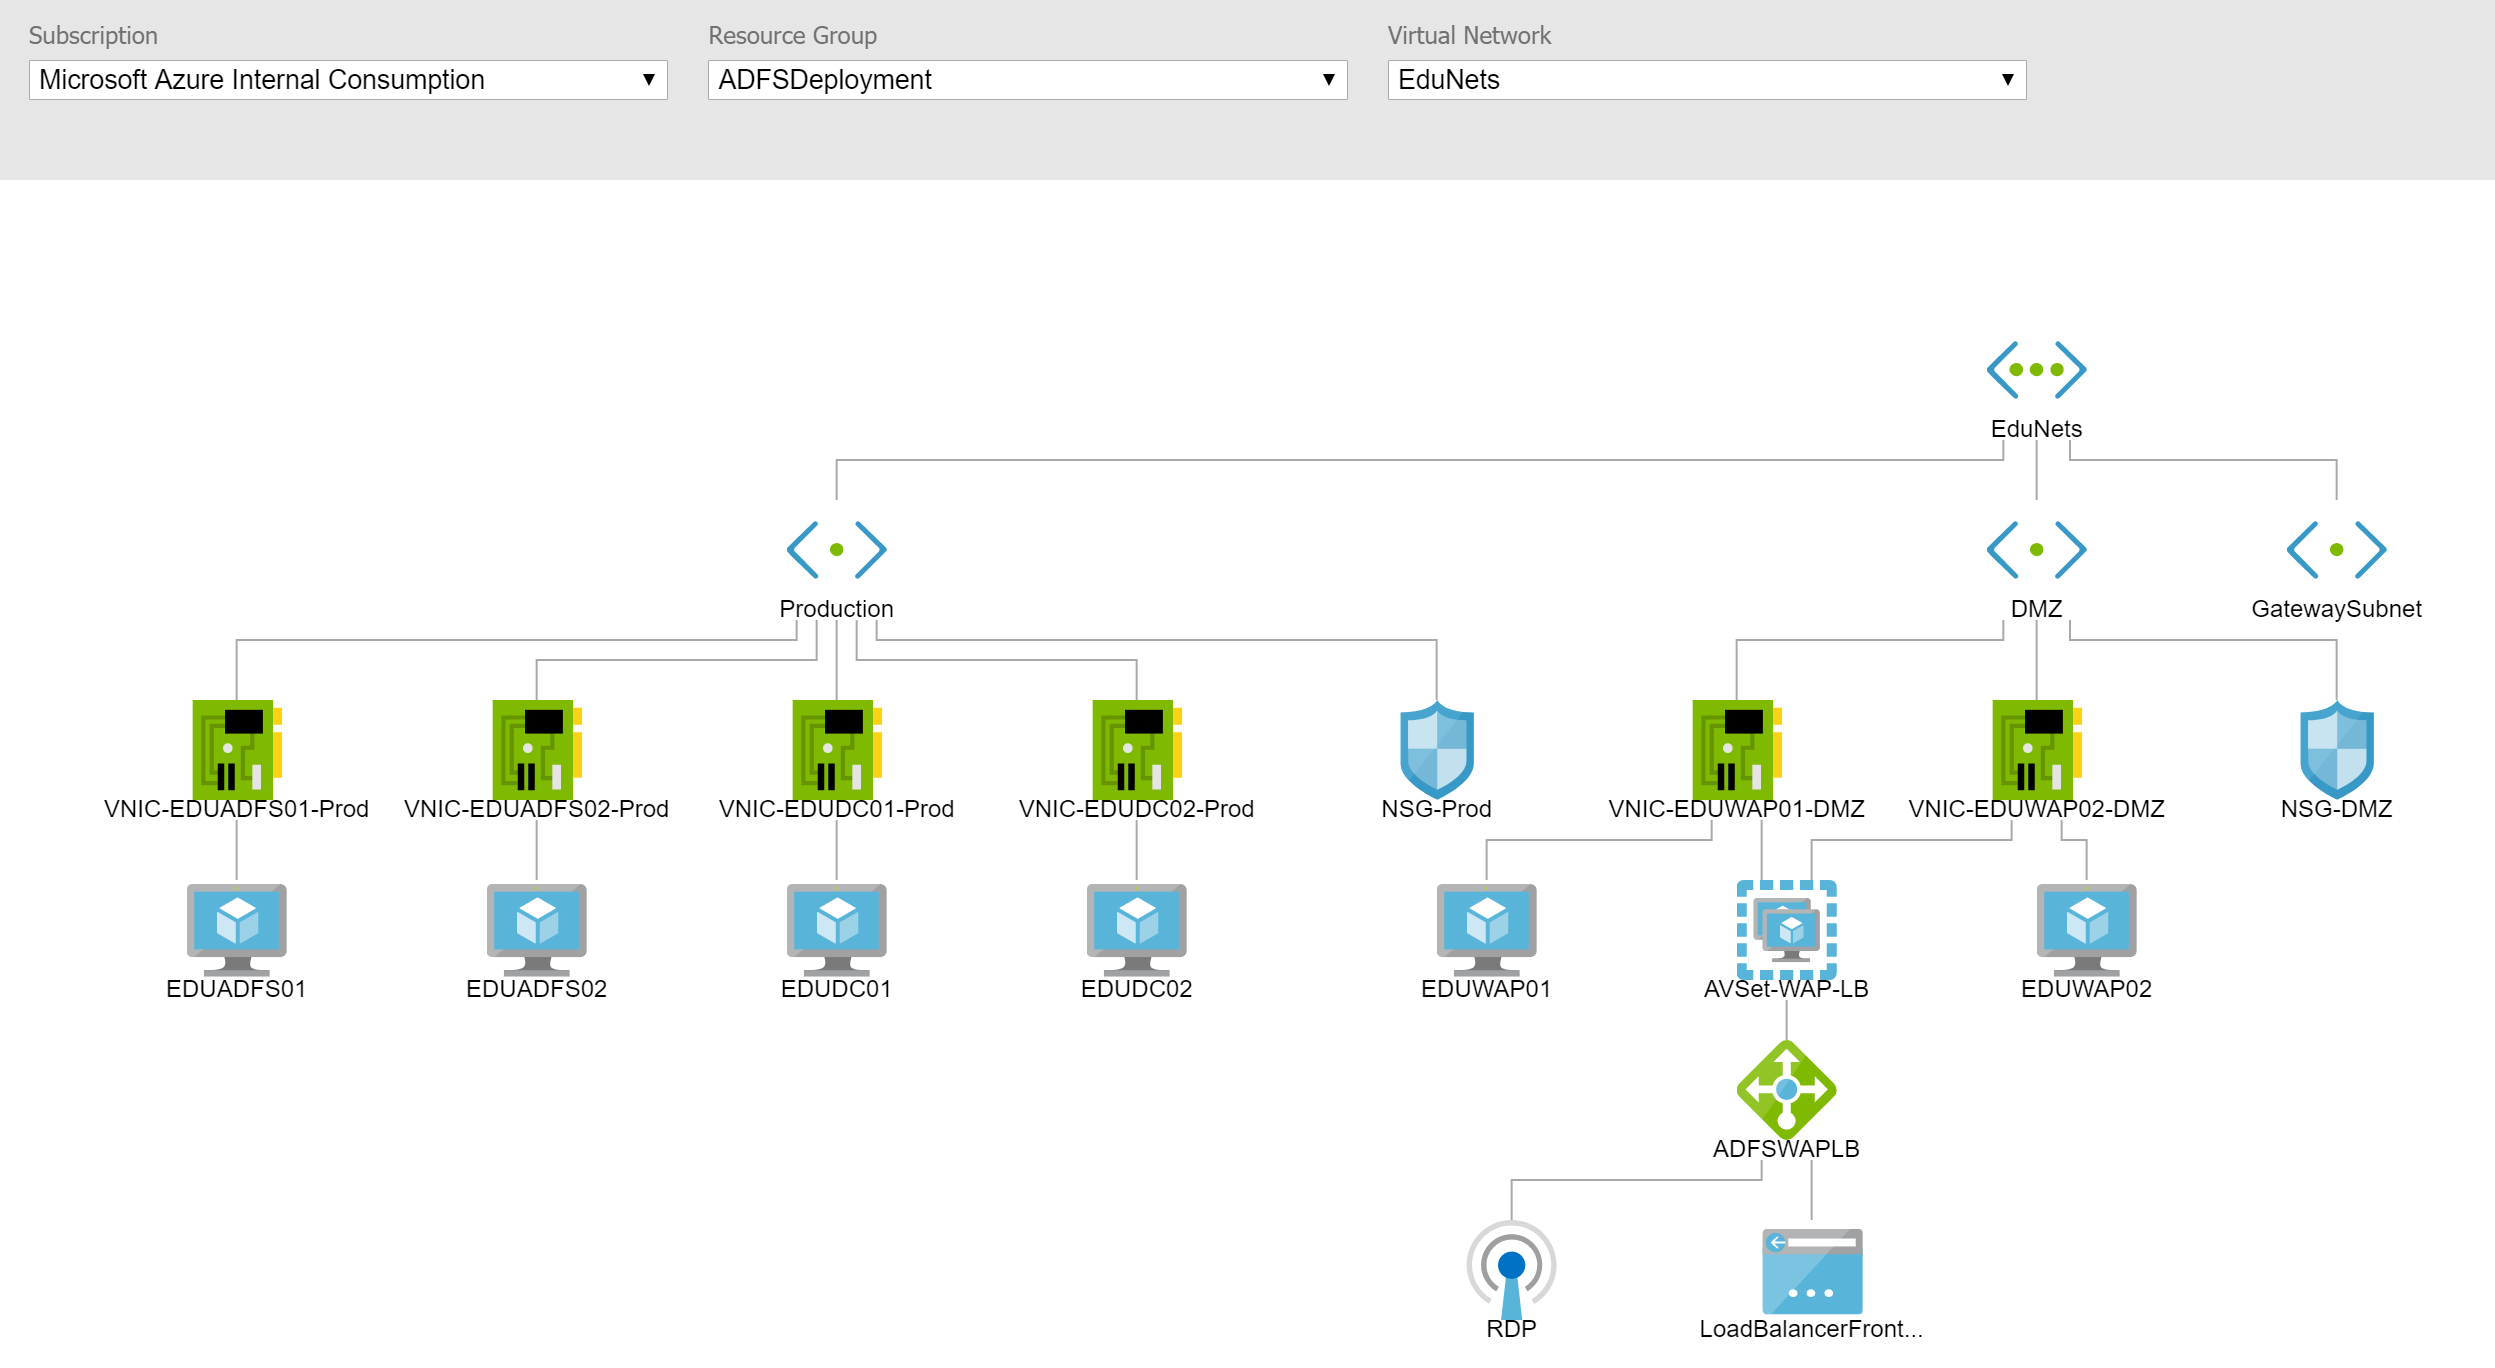
As you deploy networking components and VMs in Azure, you can have a mental idea of how everything is connected, and you can spend time building out a Visio diagram, but there is a better way. Network Watcher allows you to choose a VNet from any of your subscriptions to have the tool build out a diagram of the topology. The image below shows a diagram (rendered by Network Watcher) of an ADFS infrastructure deployed as part of my ADFS Deployment Series from a while back. Note the details included for NICs, NSGs, Subnets, load balancers, etc. The tool also lets you download a copy for your own documentation and internal sharing needs.
Various layers of security across VNETs, subnets, and network interface cards can make it very challenging to determine if the packets sent from a source and destination are allowed. IP Flow Verify simplifies this process by allowing you to test the flow of traffic between two sources using the protocol, the source and destination IP, and the source and destination port. If the connection is blocked, you’ll be able to see the NSG that has the rules that block it.
Next hop allows you to choose a virtual machine, a network interface from that virtual machine, and finally a source and destination address. With these items chosen, click the ‘Next Hop’ button to see which route will be chosen for the destination IP address. This can be helpful if you are defining custom routes and need to make sure the routing is working as you expected.
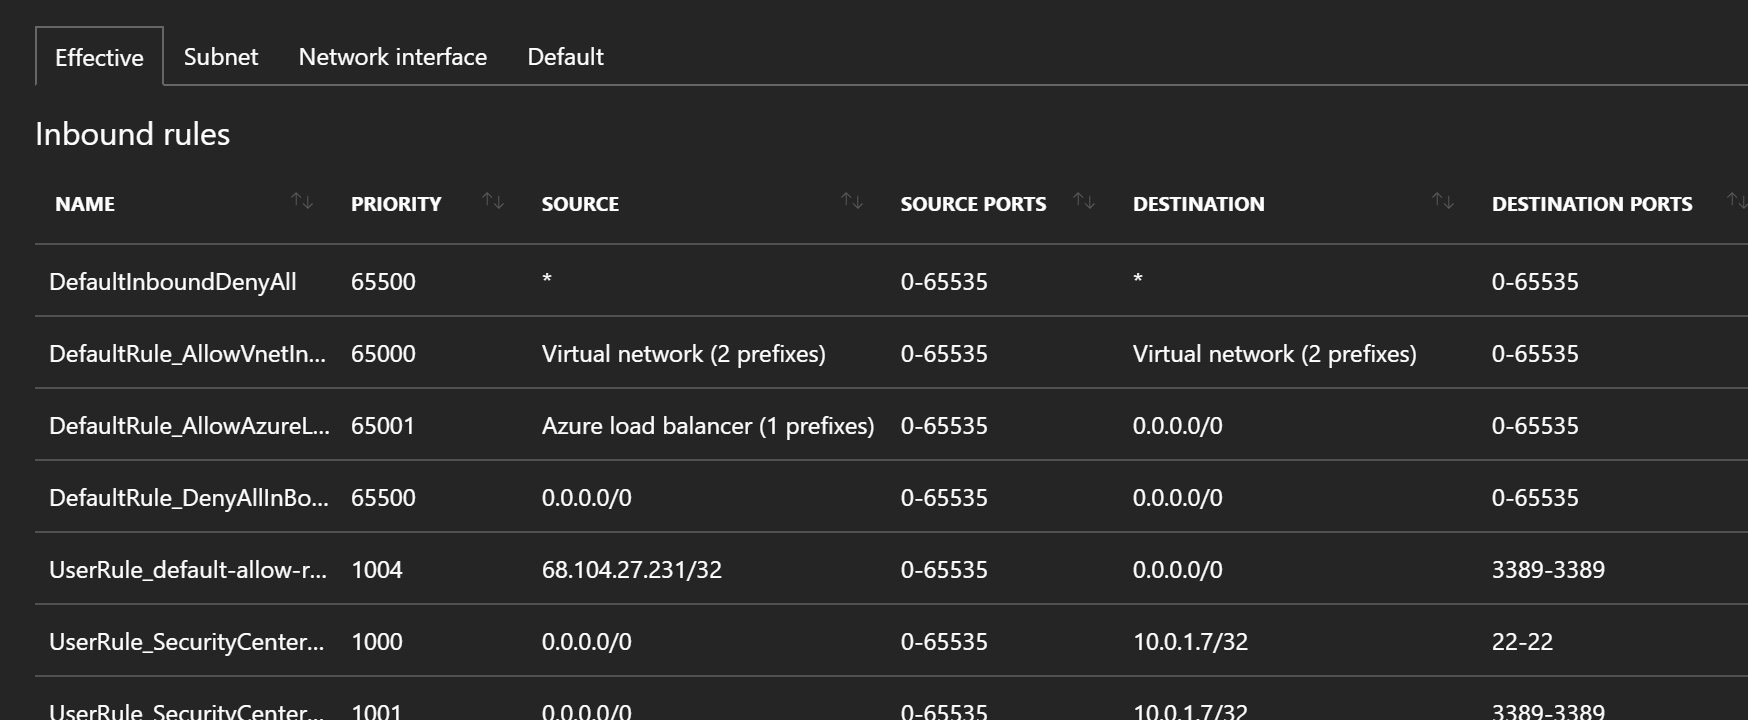
This tool is very helpful to understand the ‘effective’ results of various Network Security Groups that impact a particular VM. With the tool you simply choose a VM, and let the tool output the effective rules as seen in the graphic below. You can then find the scope of where a particular rule is set by clicking on the tabs for subnet, NIC, and default. Note: If you have started using Security Center Just-in-time security rules, this is an interesting place to see how those are applied (rules 1000 and 1001 below were automated from Security Center JIT)
Virtual Network Gateway Troubleshooting
Have a VPN or ExpressRoute connection that you would like to troubleshoot? Network Watcher provides us with the capability of troubleshooting both the gateway and connections that may be experiencing issues. You will be able to see error messages and capture log data for review.
This powerful feature allows you to capture packets as they enter or leave a virtual machine. This is useful for analysis, intrusion detection, performance monitoring, and more. You can selectively capture packets that meet certain criteria for a limited amount of time. You could also use alerts from Azure monitor to programmatically enable a packet capture scenario. Captured data can be placed in blob storage and downloaded as a standard .cap file.
At the time of this post, Connectivity Check is still in preview, however it is something you can use if you have preview features turned on in your subscription. The essence of this tool is to give you the ability to actually test connectivity between two VMs in Azure, or a VM in Azure and some FQDN, URI, or IPv4 address. The results returned will include a connection status of ‘reachable’ or ‘unreachable’.
Network Subscription Limits
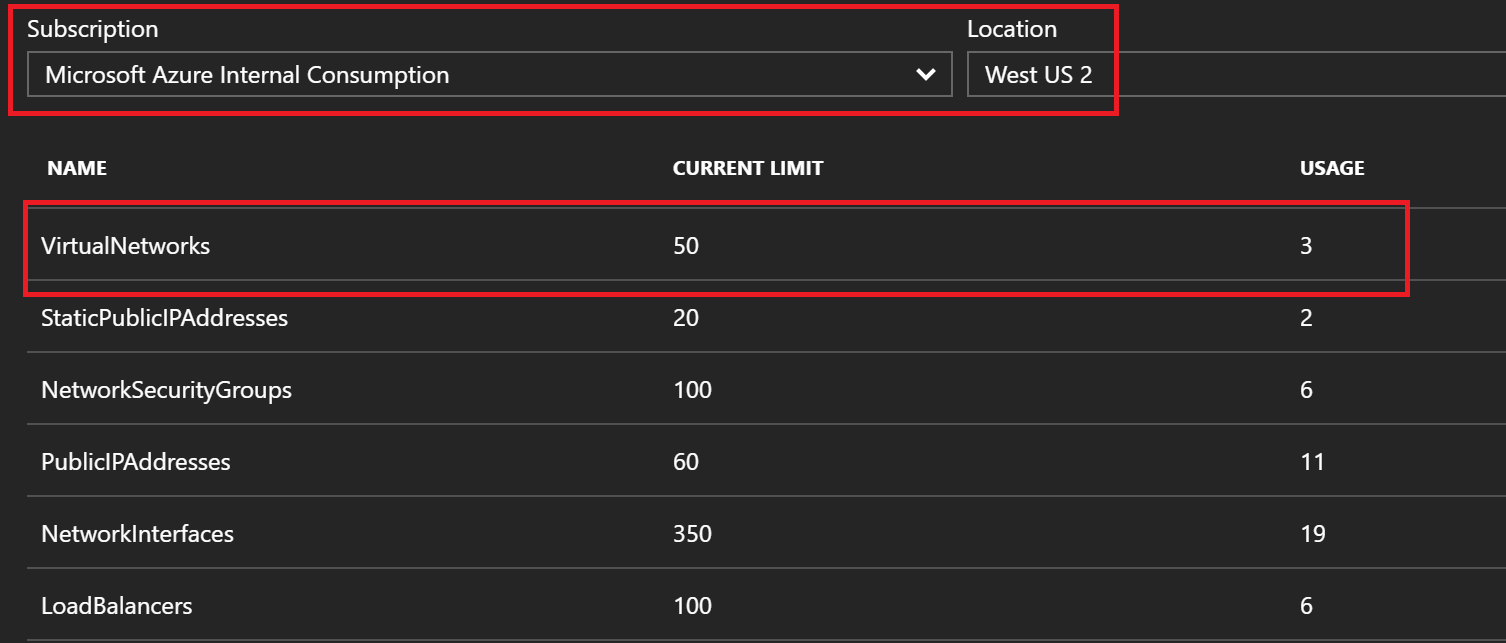
This tool lets you check in and see how much of each network resource you are using and the related limits in your subscription. This can be very useful for understanding your networking footprint and what changes you may need to make as you grow your Azure footprint. Simply choose your subscription and region, and let the tool calculate the results.
Ever wonder what traffic is flowing through a network security group? NSG flows is a logging tool that lets you turn on flow logging per NSG, choose a retention period, and then capture 5-tuple information, in JSON format, about what traffic is passing through. The output will show both allowed and denied logs, which can be helpful for troubleshooting connectivity issues, particularly if you aren’t certain of the requirements of such connections.
Application Insights
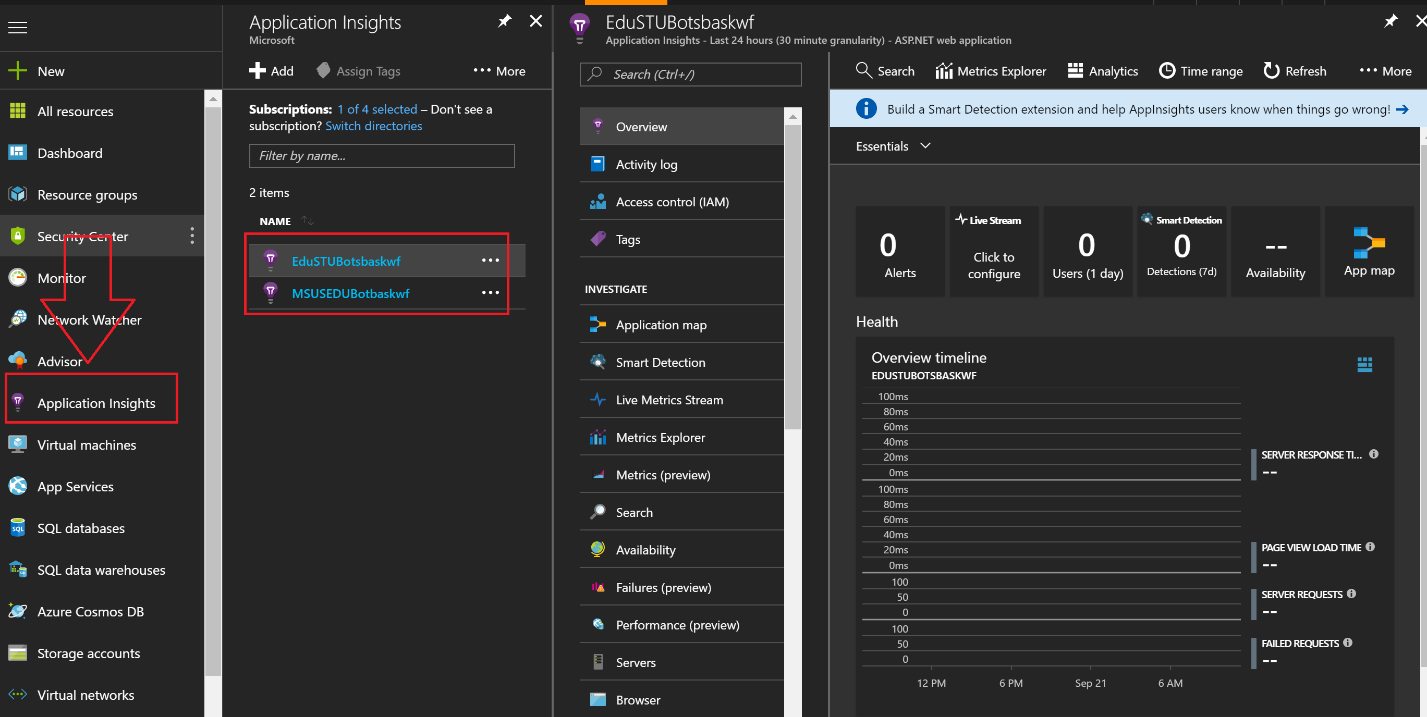
To this point, we’ve focused on monitoring Azure control plane events through Activity logs, and Guest OS level events through Azure Diagnostics. How about application level events? Application Insights is a 'monitoring as a service' solution, but specifically for Azure App Service applications. This includes WebApps, Mobile Apps, Logic Apps, etc. With Application Insights you can see page views and unique visitors, as well as failures, latency statistics, and a whole lot more. You can use the same tools as mentioned for Monitor above to export this data for alerting, viewing in PowerBI, building dashboards, triggering events, etc. In the graphic below you can see that I’ve pinned Application Insights to my favorites on the management portal. To the right of that, you’ll see the App Service applications where I’ve enabled Application Insights, and on the far right, all the tools available to me to get deep insights into my applications. You’ll want to make sure that any developers in your organization are aware of these toolsets, as this will provide significant insight into application performance and bottlenecks, while also providing useful dashboards that can output ongoing telemetry. You can learn more about Application Insights at the documentation site, but I would also advise watching the 2 minute video below to get a quick example of how it can be used.
https://applicationanalyticsmedia.azureedge.net/home_page_video.mp4?v=1
Log Analytics
Most organizations have a number of tools they use to monitor their environment, some for on-premises, some for cloud, and then additional tools for niche solutions. With Azure Log Analytics, you can collect and correlate data from multiple sources to get a unified dashboard view and gain insights to detect and mitigate IT issues.
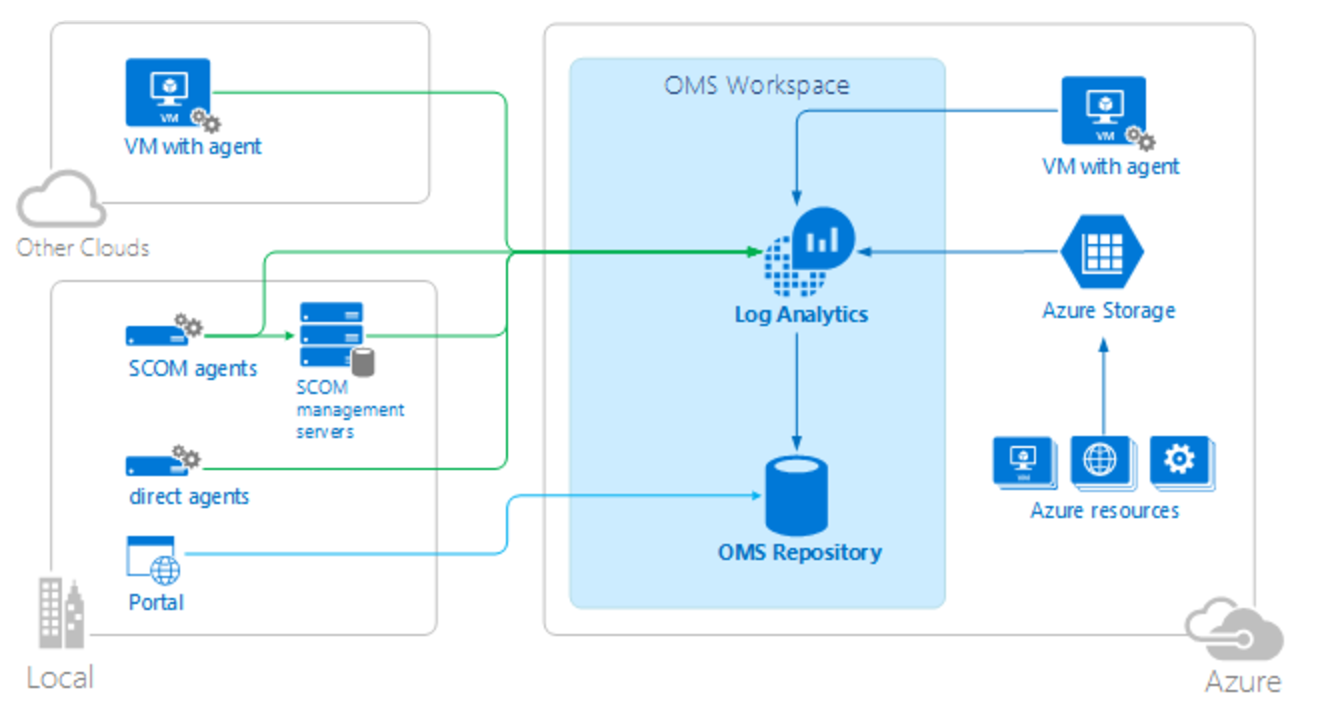
Think of Azure Monitor as a way to collect and analyze data for your Azure resources, but think of Log Analytics as the tool you can use to correlate that data with data coming from other sources such as an on-premises SCOM environment, or even VMs running in other cloud platforms. In the graphic below you can see that Log Analytics can ingest data from Azure VMs (associate Azure VMs with Log Analytics with just a few clicks), from SCOM agents you already have deployed, and from VMs or physical servers where you install the agents available for download from the Log Analytics portal. All of this data ends up in a central repository that you can manually search with a rich query language. See the query language documentation to see just how powerful these interactive queries can be.
The capabilities don’t end there. Log Analytics also provides canned solutions that are configured to look for specific things such as AD Replication Health events, SQL Health, AD Health, and the list goes on. See a clipping from the solutions gallery below. Using these solutions will give you immediate insight into the data you are collecting from all sources.

I would recommend checking out the Azure Friday video on Azure Log Analytics, and then heading over to the official documentation to learn more.
Security Center
As organizations move their workloads to the public cloud, security becomes one of the most important areas of interest and concern. Microsoft takes security very seriously, and Azure Security Center is one example of what has resulted.
Azure Security Center is a platform that helps organizations do two important tasks. First, we want to prevent attacks on our platforms by deploying secure and resilient architectures. Second, if we happen to experience some type of attack or intrusion, we want to detect it and respond appropriately. Azure Security Center gives you a set of tools to prevent and detect attacks, all centrally managed in the Azure Portal that is familiar to you. Learn how Azure Security Center detects and responds to threats on your behalf.
The graphic below shows the landing page of Security Center, which provides an overview of current recommendations and events, displays tiles that depict specific information to help you prevent attacks, and details information that helps you understand security alerts and attacked resources, so you can appropriately respond. This tool also provides the ability to provide Just-In-Time (JIT) access to VMs in the cloud by automatically updating network security groups to allow connections and then closing those connections automatically after a specified period of time. In addition, you can create application white lists to allow the tool to prevent any application not on the list from being executed in your VMs. To get started with Azure Security Center and learn how you can use the tool to protect, detect, and alert you to events, see the landing page.
Important Update! - Azure Security Center can now monitor your on-premises and 3rd party cloud applications!

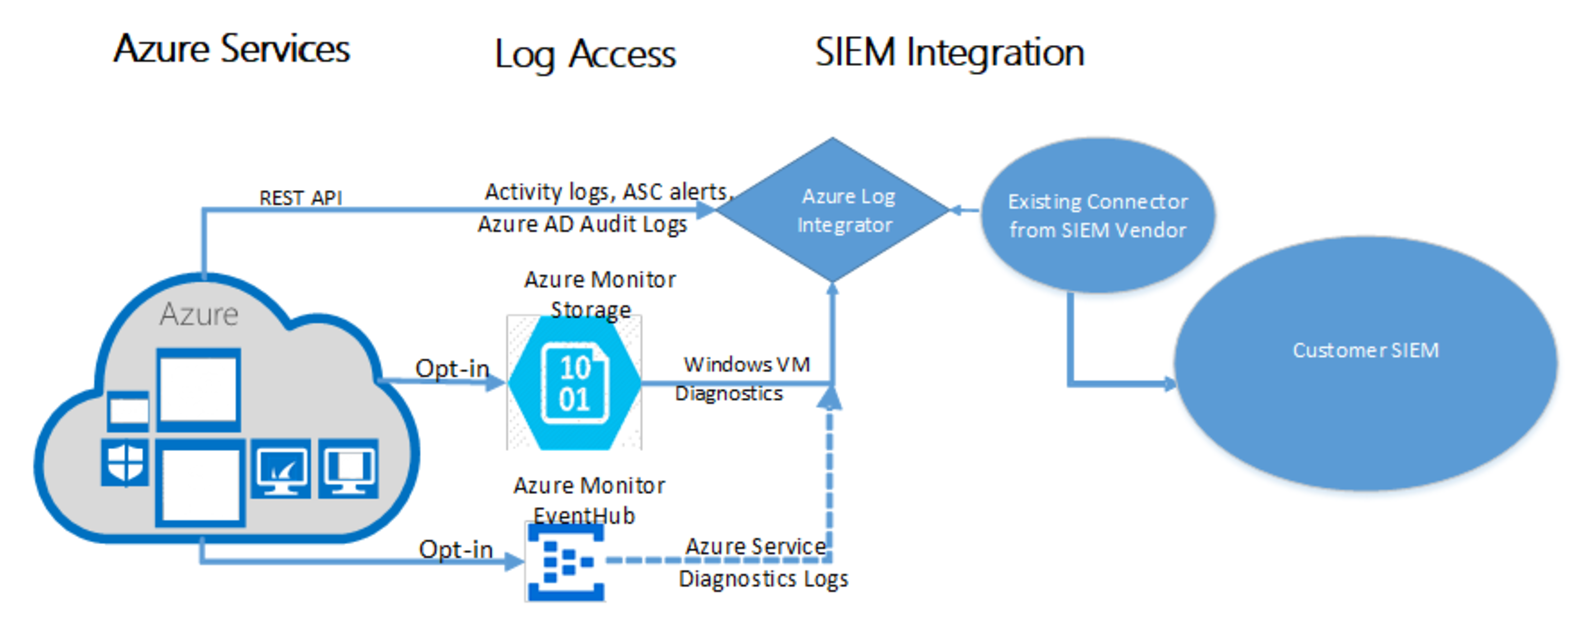
Azure Log Integration
The Azure Log Integration service is a tool you can download and install onto a Windows Server 2008 R2 or later server, which enables you to gather raw logs from Azure resources and share those logs with third party SIEM systems. You can choose to install on a server running in your own datacenter or in Azure. Please check out the overview of the tool and detailed installation instructions to learn more.
Once installed, the tool collects Windows events, Azure AD Audit logs, Azure activity logs, Azure Security Center alerts, and Azure Diagnostics logs from Azure. The graphic below depicts how the integration works with third party SIEM systems including Splunk, HP Arcsight, and IBM QRader. You can read about partner integration here.