Debugging Docker Containers (attaching)
The Azure Developer Community blog has moved! Find this blog post over on our new blog at the Microsoft Tech Community:
=================
Visual Studio has excellent built in support for working with Docker containers and most of the examples on the web are written  with those tools installed. But what about the situation where the container is already running? This post will provide an example of debugging a .Net Framework application running a windows container as well as provide references to posts about remote debugging for different platforms including the .Net Framework, Python, and .Net Core applications.
General
In all three examples, the container needs to be prepared to allow for Visual Studio to access a running process on the container. Most devs are familiar with debugging solutions at design time using both the auto-attach (F5) and attaching the debugger to a running process on their local machine. This approach can be used to attach to a remote computer and even to Azure Web Apps and Azure Functions.
Attaching to a container is similar to those examples where the ability to remote debug needs to be enabled on the container to allow Visual Studio the ability to connect.
.Net Framework
The first step to enabling the debug of a .Net Framework app is to install and run the remote debugger. The following is an example of enabling this on a dockerfile that uses Microsoft's Asp.Net image:
[code lang="bash"]
FROM microsoft/aspnet:10.0.14393.2665
EXPOSE 4020 4021
# download the remote debugger
RUN Invoke-WebRequest -OutFile c:\rtools_setup_x64.exe -Uri https://download.microsoft.com/download/1/2/2/1225c23d-3599-48c9-a314-f7d631f43241/rtools\_setup\_x64.exe;
# install the remote debugging
RUN & 'c:\rtools_setup_x64.exe' /install /quiet
# rest of the docker file
After the image has been built, the next step is to make sure the ports for remote debugging (-p 4020:4020 -p 4021:4021) are also mapped when running the container. For example, the following starts the container with the name "mysite" and exposes ports 4020 and 4021 and port 80 as port 8078.
[code]
docker run -d -p 4020:4020 -p 4021:4021 -p 8078:80 --name mysite core
The final step is to start the remote debugger on the container as shown below:
[code]
docker exec -it mysite "C:\Program Files\Microsoft Visual Studio 14.0\Common7\IDE\Remote Debugger\x64\msvsmon.exe" /nostatus /silent /noauth /anyuser /nosecuritywarn
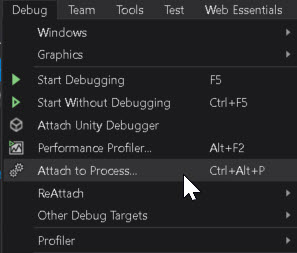
Within Visual Studio, select the Attach to Process action in the Debug window:
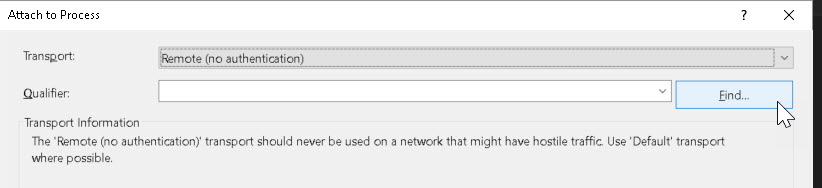
In the Transport, Remote is used and the Find button is used to establish the remote connection:
The screenshot below shows the detected containers:
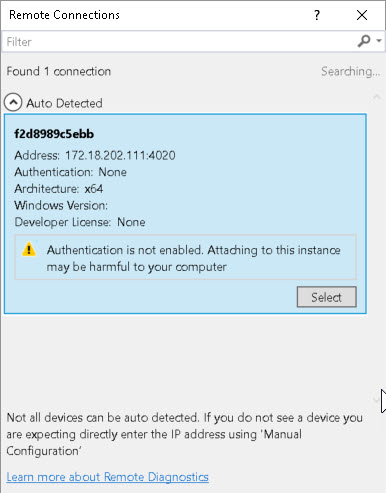
If there is more than one container detected, you can determine the specific IP address of the container by using the docker inspect command:
[code]
docker inspect -f "{{ .NetworkSettings.Networks.nat.IPAddress }}" mysite
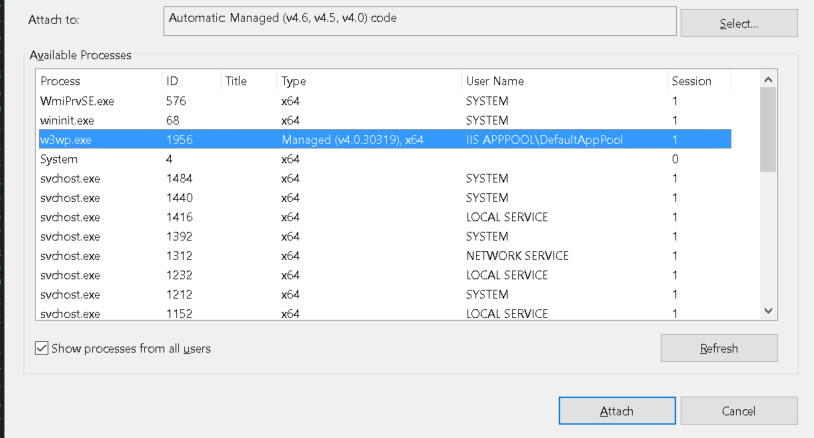
Once the container has been selected, then the running process can be selected. For example, if debugging a IIS web application:
Hope this helps! Please post any helpful comments for others and any other links you might know of!
References
.Net Framework
Another example of remote debugging .Net Framework applications can be found in post by Richard Banks: How to Remote Debug a .NET App in a Windows Docker Container.
.Net Core
Offroad Debugging of .NET Core on Linux OSX from Visual Studio Debug .NetCore Containers in Docker and Kubernetes