Ask Learn
Preview
Ask Learn is an AI assistant that can answer questions, clarify concepts, and define terms using trusted Microsoft documentation.
Please sign in to use Ask Learn.
Sign inThis browser is no longer supported.
Upgrade to Microsoft Edge to take advantage of the latest features, security updates, and technical support.
Note
Access to this page requires authorization. You can try signing in or changing directories.
Access to this page requires authorization. You can try changing directories.
Have you ever been surprised by a larger-than-expected monthly Azure Data Lake Analytics bill? Creating alerts using Log Analytics will help you know when the bill is growing more than it should. In this post, I will show you how to create an alert that emails a message whenever the total AUs assigned to jobs exceeds a daily threshold. – it’s easy to get started!
This is another post in a series on how to save money and reduce costs with Azure Data Lake Analytics.
Follow the steps in our previous blog post on Log Analytics to connect your accounts and start collecting usage and diagnostics logs – in this specific case, make sure you select the Audit logs to create this alert:
[caption id="attachment_9665" align="alignnone" width="561"]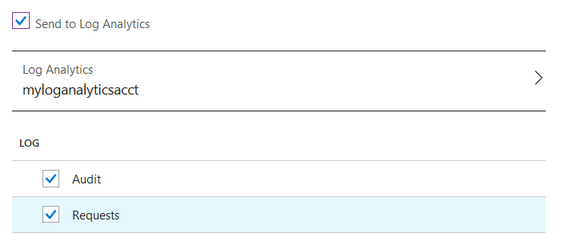 Selecting the type of event logs to share to Log Analytics[/caption]
A simple Azure Log Analytics query showing the recently completed jobs is:
 search *
 | where Type == "AzureDiagnostics"
 | where ResourceProvider == "MICROSOFT.DATALAKEANALYTICS"
 | where OperationName == "JobEnded
[caption id="attachment_9895" align="alignnone" width="353"] Log Analytics entry for a completed Azure Data Lake Analytics job[/caption]
The attribute Parallelism_d in the previous query, contains the total number of AUs assigned by the user on a job that has ended (regardless of status). The following query aggregates the results on a 1-day interval and sums all the values of the Parallelism_d column, returning the total AUs assigned by users to jobs that ended. Note that this is not the total number of AU-hours (we will cover that on a later blog post).
We will use this query to power our Log Analytics alert:
 search *
 | where Type == "AzureDiagnostics"
 | where ResourceProvider == "MICROSOFT.DATALAKEANALYTICS"
 | where OperationName == "JobEnded"
 | summarize AggregatedValue = sum(Parallelism_d)  by bin(TimeGenerated, 1d)
[caption id="attachment_9765" align="alignnone" width="609"] Log Analytics query that sums all the AUs assigned by users for jobs in a day[/caption]
If you want to see the step-by-step guide to create a new Log Analytics alert, check out our recent blog post on creating Log Analytics Alerts.
For the alert signal logic, use the following values:
[caption id="attachment_9755" align="alignnone" width="435"] Alert signal logic and settings[/caption]
After one or more jobs exceed the AU threshold set in the alert within a 24 hour period, the users/teams in the alert action group will get an email alert:
[caption id="attachment_9865" align="alignnone" width="722"]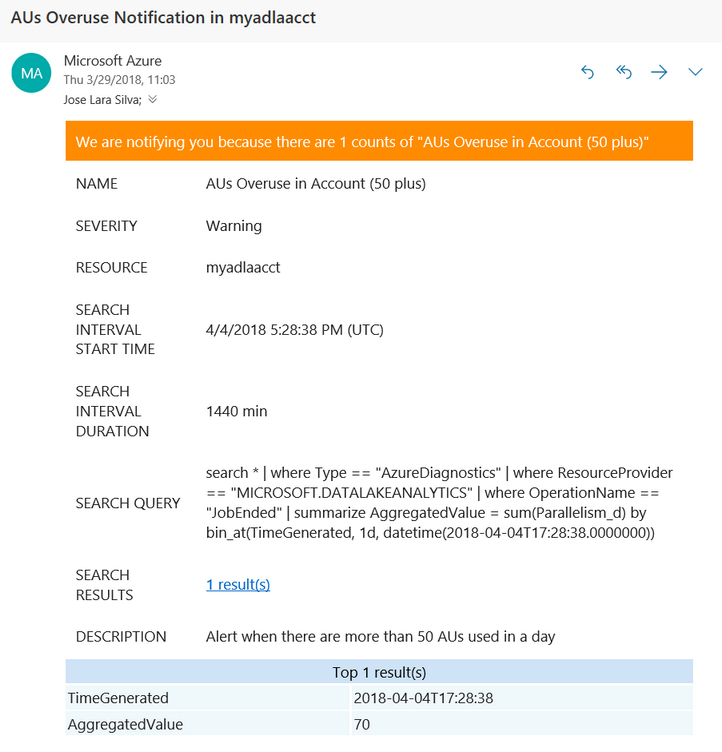 Alert notification email[/caption]
In this blog post I showed you how to set up and alert whenever a specific threshold of AUs is exceeded. This usage alert can directly help to manage costs and understand the Data Lake Analytics usage in your organization - create your notifications and share your experiences with us!
In future posts, we'll cover other useful alerts and notifications that can be set up for your Azure Data Lake Analytics and Data Lake Store accounts. Go ahead and set your own usage alerts -- it's easy to get started!
Ask Learn is an AI assistant that can answer questions, clarify concepts, and define terms using trusted Microsoft documentation.
Please sign in to use Ask Learn.
Sign in