From unstructured data to dashboard with Azure Data Factory and Azure Data Lake
When I joined the Big Data team at Microsoft, sifting through all the technologies and products left me with more questions than answers – as it does for many customers taking their first steps on the cloud. I’ve always learned best by doing, so I decided to roll up my sleeves and build something in Azure to familiarize myself with how the different services fit together. My goal: construct a simple data pipeline that moves unstructured data from an existing cloud source into Azure and visualizes it with PowerBI.
Should be easy, right? Here’s how I broke this goal into 3 tasks:
- Task 1: Move data from Amazon S3 to Azure Data Lake Store (ADLS) via Azure Data Factory (ADF)
- Task 2: Transform the data with Azure Data Lake Analytics (ADLA)
- Task 3: Visualize the data with Power BI
Task 1: Move my data from S3 to ADLS via ADF
To move my data from S3 to ADLS, I used ADF to build and run a copy pipeline. Any pipeline in ADF is composed of six objects:
- Integration runtime
- Source linked service
- Sink linked service
- Source dataset
- Sink dataset
- At least one activity (ex: copy data)
While this seems like a lot of parts just to copy a few files, it's important to note I only scratched the surface of what ADF can do. Think of ADF as an airline company that manages and enables cargo (data) movement between cities (data sources). A pipeline represents the overall goal of moving certain cargo from one city to another. The linked service is the airport, which provides a landing point and access control for the cities. The dataset is the list of cargo to move, the activity is the flight itself, while the integration runtime is the airport infrastructure that makes the cargo movement possible. A single pipeline requires all these objects to run successfully; however, many pipelines can use these same objects to complete different tasks. Once you’ve created these data factory objects, it is straightforward to layer on additional functionality or more pipelines. ADF also has visual tools that make building these objects a breeze – to build my pipeline, all I had to do was click on “Copy data” in the visual tools start menu and follow the steps provided.
Before establishing the connections between S3, ADF, and ADLS, I needed to create access keys to both of my storage accounts. Since it's bad practice to use root credentials for access, I created a new user role in each service and assigned it only the necessary permissions to read or write data to my accounts. For S3, I created a user role in AWS’s IAM service and assigning it the following S3 permissions, which then gave me a public and private key, which I used when establishing the S3 linked service through ADF.
- ListBucket
- ListAllMyBuckets
- GetBucketLocation
- GetObject
- GetObjectVersion
For ADLS, I created a web application through Azure Active Directory (AAD) to serve as my new user, and plugged its application ID, authentication key, and tenant ID into the ADLS linked service as "service principal ID", "service principle key", and "tenant", respectively. Then, I went to my ADLS account and assigned the web application 'write' and 'execute' access to the target folder, and 'execute' access to parent folders in the path - this is the minimum amount of access Data Factory needs to copy data into my store account.
After authorizing the linked services through the visual tools, I followed the ADF prompts to finish creating the pipeline. Since this is a basic pipeline, I didn’t add any transformations to my datasets or retry options to the pipeline – however, the visual tools make it easy for me to return and add more complexity and functionality. After creating the pipeline and executing a test run for validation, I manually triggered the pipeline and navigated to my ADLS account. Once the pipeline finished, I opened the ADLS data explorer and confirmed my data had landed in its new home.
Task 2: Transform my data with ADLA
Now that I had my data in ADLS, it was time to transform my data to prepare it for an analytics dashboard. To get an idea of the schema I was working with, I used the ADLS data explorer to preview the data - while it was readable, the data was split into different files by year. To fix this, I wrote a simple U-SQL script that joins the data into a single file. U-SQL makes this task trivial through file sets: I simply define a filename pattern with a wildcard, and U-SQL extracts the data from all filenames that match the pattern, and then saves the wildcard value ({_year} in my script) as a new column, enabling me to extract information from the filename as well. All of this is done in a single line in my script:
@FROM "/EPA_data/raw_data/aqi/year/annual_aqi_by_county_{_year}.csv
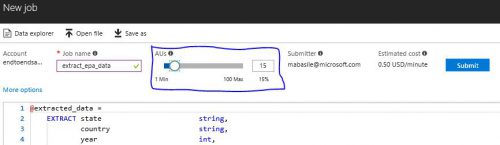
The remainder of the script orders the data by its year, and then outputs a new CSV file containing all of the data. Before submitting my job, I used the slider above the script (see below) to allocate 15 Analytic Units (AUs) to automatically increase the job's parallelization for a higher cost. Varying the amount of AUs allows you to make the best choice on price versus performance - however, a job’s minimum runtime is also dependent on other factors like data skew.
After the job finished, I previewed the new, consolidated file in the ADLS data explorer to confirm it contained data from all years. I could have also checked the job graph in ADLA for more information about runtime, cost, data I/O, and performance optimizations, or debugged my job there if something went wrong.
Task 3: Connect PowerBI to my data
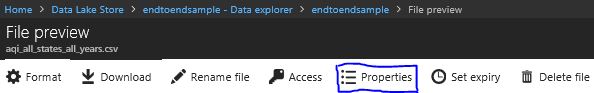
With my data consolidated to a single file, I could now visualize it through PowerBI. Since this dataset is under 10 GB, I connected PowerBI directly to my ADLS account. If my dataset was too large for a direct ADLS connection, I could have moved my data to SQL DB or SQL DW). I selected Azure Data Lake Store under "Get Data" in PowerBI and inputted the file’s URL, found in the Properties tab in the ADLS file preview.
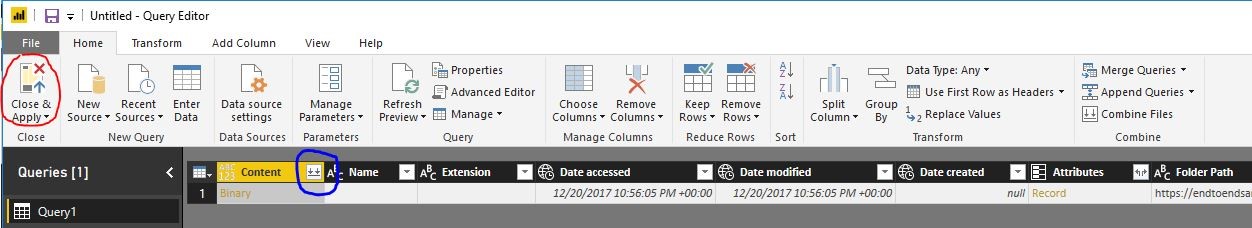
Once PowerBI connected to the file, I edited the query before loading it so PowerBI would read the contents of the file and not its metadata. In the popup query window, I clicked the double downward arrows (circled in blue) to read the contents of the file; once I saw the correct column names appear, I closed and applied my changes (circled in red).
With my data cleaned and loaded, it was now time to have some fun and build visualizations. Two my favorite examples were a heat map of the US showing how each state compared by their worst air quality value for each year, and a line and bar chart of how the air quality here in Redmond has changed over time.
And that’s all there is to it! An end-to-end data pipeline that takes unstructured data from an external cloud source and turns it into insights on PowerBI. After creating this pipeline, I’ve learned a few things about working on Azure. First, getting started wasn't as simple as I had hoped. While ADL's and ADF's tooling were straightforward, I still felt I had to jump through some hoops to start playing around on Azure. However, I was also surprised as to how much of Azure’s functionality and strength is accessible once I cleared those initial hurdles. With this pipeline built, features like ADLA’s job graph and performance optimization or U-SQL’s built-in cognitive capabilities are now only a few clicks or lines of code away. I'm excited to continue exploring Azure Data Lake and making use of its advanced functionality, and I want to help new users reach this point as well! Below you’ll find instructions to recreate this pipeline yourself – I hope you’re as excited as I am to use this pipeline as a diving board to jump into Azure Data Lake.
Want to try this yourself?
Video walkthrough
If you’re interested in recreating this pipeline, you can find copies of the script I used on Github. You’ll need an Azure subscription and an account for each one of the services used. I downloaded my dataset from the EPA (yearly AQI by county), but any dataset would work! Below is some of the documentation I found most helpful. If you have any questions about replicating this pipeline, feel free to reach out in the comments below!