Debugging Azure Data Lake Job Failures Made Easy (part 2) - Efficiently troubleshoot anomalies in recurring jobs
Azure Data Lake Analytics recently announced advanced job tracking and management features that make it easy to work with pipelines and recurring jobs. Releases after version 2.3.0000.1 of Azure Data Lake Tools for Visual Studio, introduce new features that simplify analyzing and troubleshooting such jobs.
Troubleshooting issues in recurring job is a time-consuming task. It starts with searching through the Job Browser to find instances of a recurring job and identifying both baseline and anomalous performance. This is followed by multi-way comparisons between job instances to figure out what has been changed in the query, data or environment. This is followed by analysis to discover which changes may have performance impact. While this is happening production workloads continue to under-perform or go down.
Azure Data Lake Tools for Visual Studio now makes it easy to spot anomalies and quickly trace the key characteristics across recurring job instances allowing for an efficient debugging experience. The Pipeline Browser automatically groups recurring jobs to simplify discovery of all runs. The Related Job View collects data about inputs, outputs and execution across multiple runs into a single visualization.
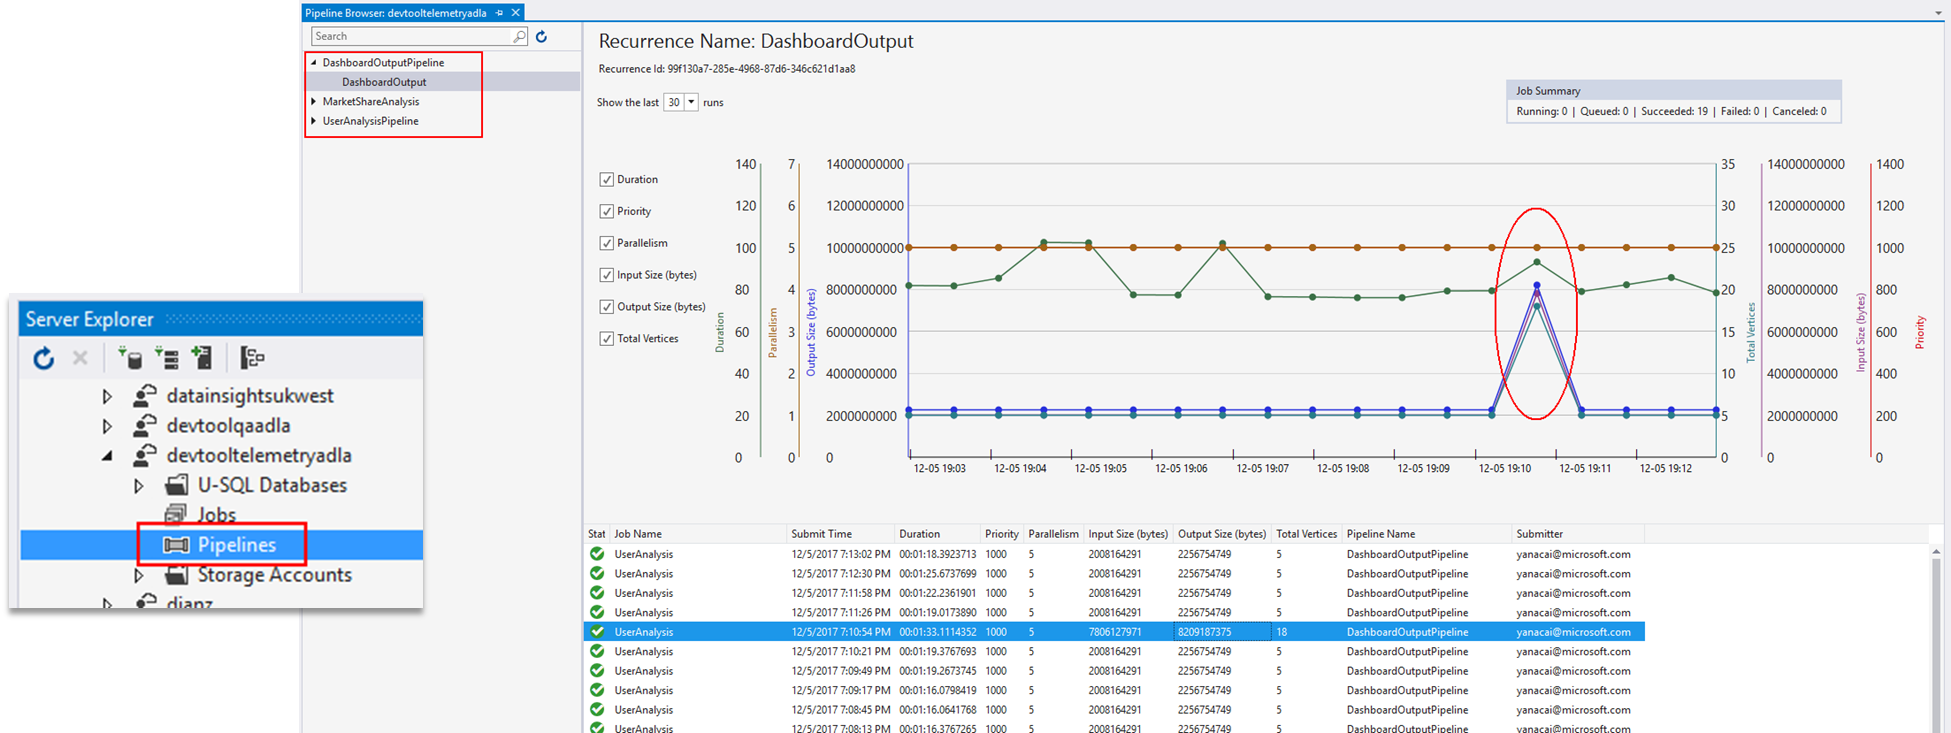
Correlations between the input data size and job duration are a common starting point for troubleshooting slow jobs. If input data size and job duration go up together you should investigate why that day’s input data has grown unexpectedly. You can drill down to the input data through the specific job in the Related Job View list.
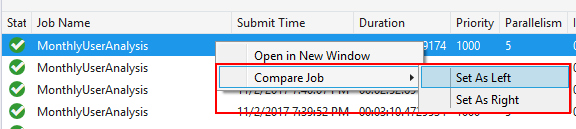
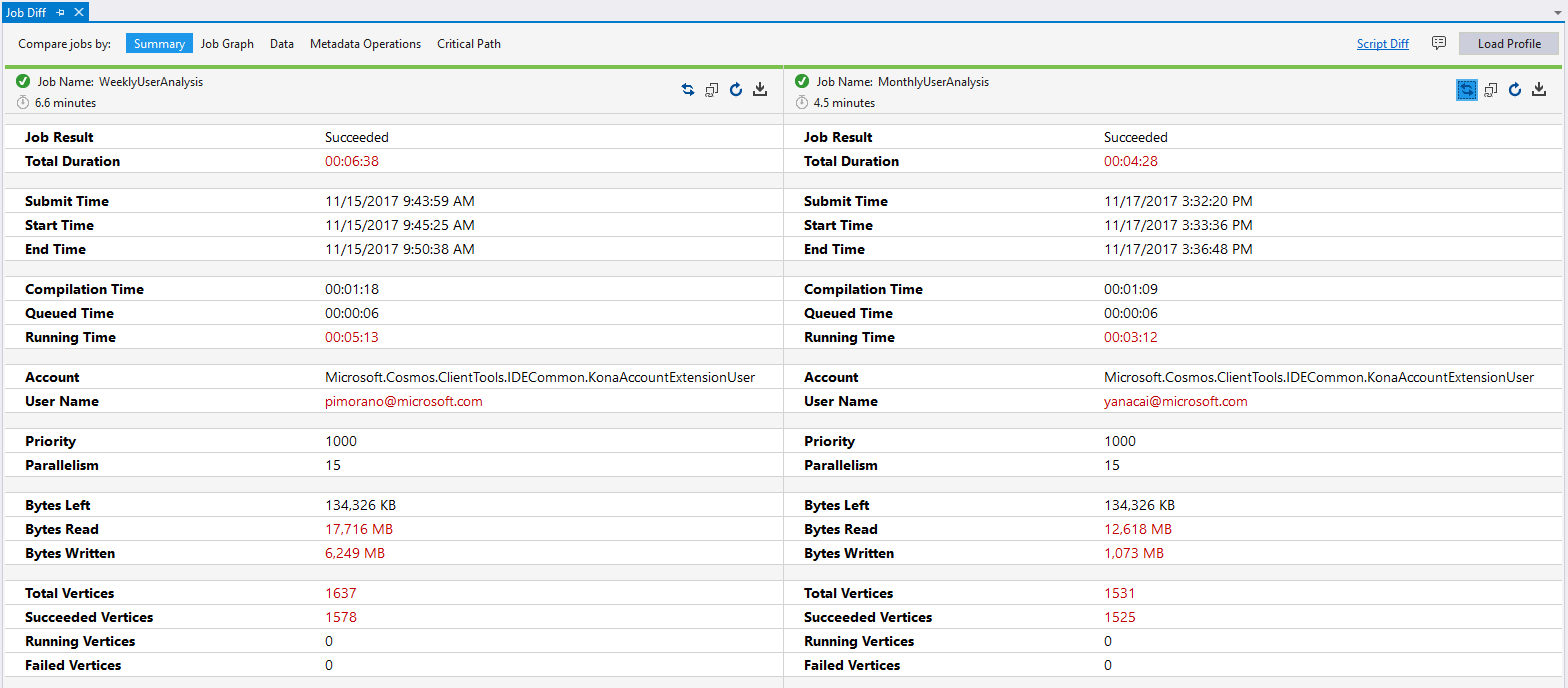
In another case, you might find that input data size remains constant, but the duration of a job run spikes above average. In this case, use the job list to select the job in question and another “average” job and compare the two by using the context menu. The Job Diff View here helps to guide you through significant differences in the query code and detailed execution metrics.
 How to troubleshoot a recurring job provides more details on how to do this.
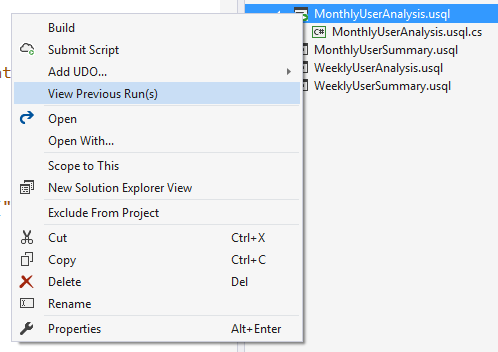
Another useful feature during new code development is the ability to track multiple submissions of the same script as a single recurring job. During script development, it is common to submit the script multiple times to verify the results and tune the performance. The tool helps you track this by assigning a recurrence ID (named as <script name>_ADLVSTool) and using it to group all submission as “previous runs”. In the Solution Explorer, right click the U-SQL script in the project and choose View Previous Run(s) to see all previous ADLA executions for the script. The results are shown using the same Related Job View making it straightforward to investigate changes between runs.
Feel free to contact us at adldevtool@microsoft.com if you have problems or feedback, we shall be happy to hear your voice.