Organize your pipeline and recurring jobs easily with Data Lake Analytics (part 2)
Identify performance problems and reduce failed jobs with pipeline and recurring job information
In part 1, we showed you how to tag and explore your pipeline and recurring jobs:
- Tag jobs with the new pipeline and recurring job metadata using Azure PowerShell
- Explore pipeline and recurring jobs using Azure Portal and Azure PowerShell
In this blog, we will show you how to leverage pipeline and recurring job information to identify performance problems and reduce failed jobs:
- Use this pipeline and recurring job information to reduce failed AU Hours using Azure Portal and Azure PowerShell
- Identify performance differences using Azure Portal and Azure PowerShell
To illustrate steps 3 and 4 above, we will continue to use our fictitious local retail startup, Contoso, that sells clothes online, which we introduced in part one as an example.
3) Use pipeline and recurring job information to reduce failed AU Hours using Azure Portal and Azure PowerShell
In theory, jobs that are part of a production pipeline are expected to perform consistently and should rarely fail, if at all. For example, Contoso has jobs that run every day to get new and fresh data to understand their customers' usage patterns. If Contoso sees that one of their pipeline or recurring jobs are failing, then that is an indicator of a problem that they should investigate.
Previously, it was hard to quickly identify pipelines and recurring jobs with failures because only had a flat list of jobs was available. We've made it easy to identify problematic pipeline and recurring jobs at a glance by surfacing key aggregate statistics on pipeline and recurring jobs.
3a) Use pipeline and recurring job information to reduce failed AU Hours using Azure Portal
- Open your Data Lake Analytics account
- Using the Table of Contents on the left, click on "Job Insights"? or click on the graph
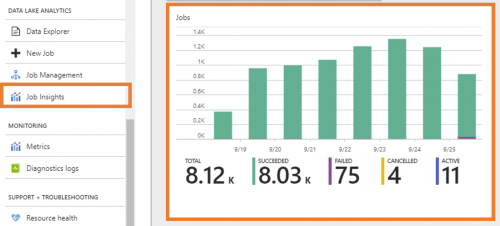
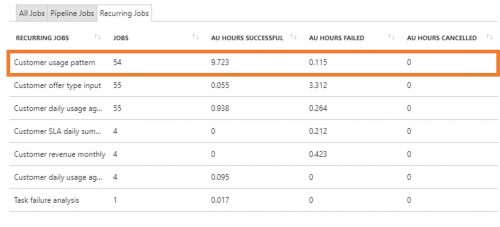
- Click on "Recurring Jobs"?
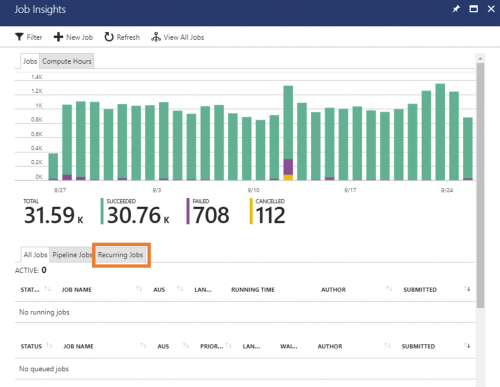
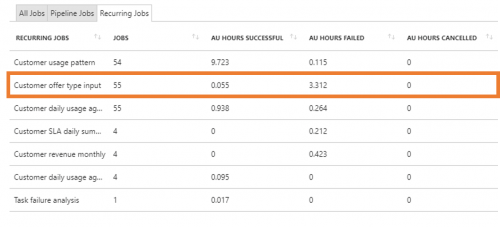
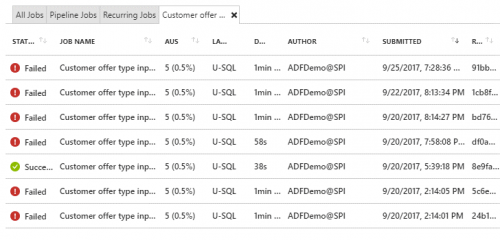
- We can quickly identify recurring jobs that are prone to failure by looking at the "AU Hours Failed"? column. In this example we see that the "Customer offer type input"? fails more than it succeeds. Click on it to see more details.
- Now we can see the exact instances of the job that fail. We can further debug the job using this information.
- Once we have debugged, tested the fix, and added the fix into our pipeline, we can use the trend graph to track the improvement.
3b) Use pipeline and recurring job information to reduce failed AU Hours using Azure PowerShell
- Get the list of Recurring Jobs
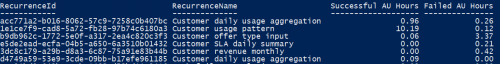
Get-AdlJobRecurrence -Account $adlaAccount | ft RecurrenceName, AuHoursSucceeded, AuHoursFailed
Here we see a list of jobs that are submitted on a recurring basis. We can quickly identify recurring jobs that are prone to failure by looking at the "AU Hours Failed"? column. In this example, we see that the "Customer offer type input" fails more than it succeeds. Let's look at all the jobs that are part of the recurring job.
- To get the list of jobs that are part of a recurring job, we can use the RecurrenceId to filter the job list.
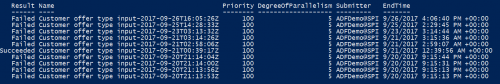
Get-AdlJob -Account $adlaAccount -RecurrenceId b9db962c-1772-5e0f-a317-2ea4c820c3f3 -Top 10 | Format-Table Result, Name, Priority, DegreeOfParallelism, Submitter, EndTime
Now we can see the exact instances of the job that fail. We can further debug the job using this information.
4) Identify performance differences using Azure Portal and Azure PowerShell
Recurring jobs should have a stable runtime because the logic is the same and the input data should be relatively similar between each run of the job. Significant performance differences are symptoms of larger problems such as the input data is smaller than expected; alternatively, the input has grown too big and can use more AUs.
4a) Identify performance differences using Azure Portal
- Open your Data Lake Analytics account
- Using the Table of Contents on the left, click on "Job Insights"? or click on the graph
- Click on "Recurring Jobs"?
- Let's look at the "Customer usage pattern" recurring job.
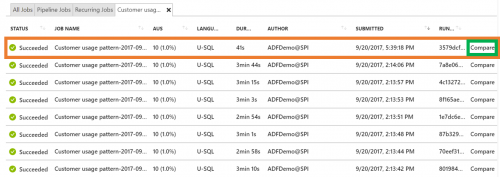
- In the job list below, we can see that this job usually takes roughly 3 minutes to complete. The latest run of the job completed in less than 1 minute. At a glance, everything looks the same - what could cause the run time change. Let's compare the quick job and the slow job. Click on "Compare" for the fast running job.
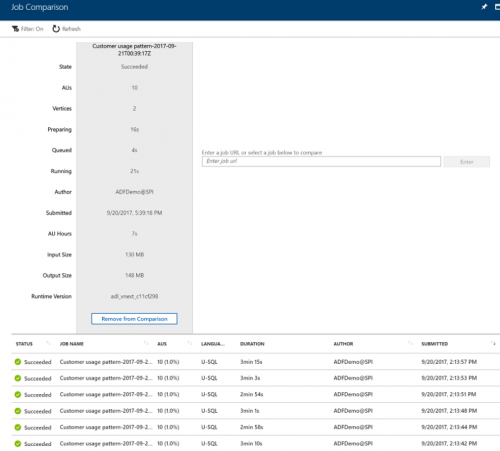
- Click on any of the usual jobs to start a comparison
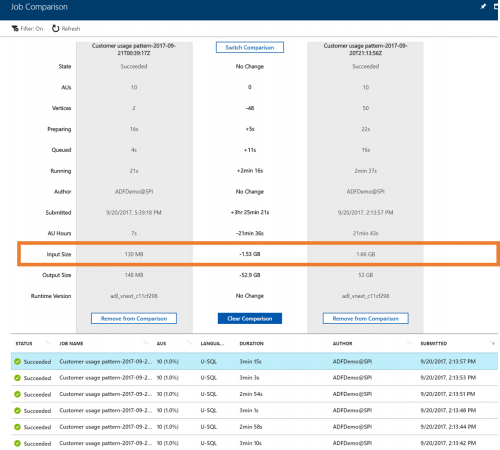
- We see that for some reason the fast running job has a significantly smaller input size. We can investigate our data ingestion pipeline to see if there are some problems there.
4b) Identify performance differences using Azure PowerShell
- Get the list of Recurring Jobs
Get-AdlJobRecurrence -Account $adlaAccount | Format-Table RecurrenceName, AuHoursSucceeded, AuHoursFailed
Here we see a list of jobs that are submitted on a recurring basis.

- Let's look at the "customer usage pattern"? recurring job that's often successful. To get the list of jobs that are part of a recurring job, we can use the RecurrenceId to filter the job list:
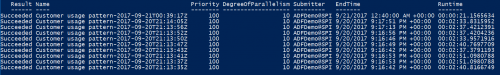
Get-AdlJob -Account $adlaAccount -RecurrenceId 1e1ce7f9-cad8-5a72-fb28-97b74c6180a3 -Top 10 | Format-Table Result, Name, Priority, DegreeOfParallelism, Submitter, EndTime, @{Name="Runtime"; Expression={$_.EndTime-$_.StartTime};}
In the job list below, we can see that this job usually takes roughly 3 minutes to complete. The latest run of the job completed in less than 1 minute. At a glance, everything looks the same -- what could cause the run time change. Let's compare the quick job and the slow job.
- To compare the quick job and any of the other jobs, we can get the 2 job objects:
#unusually fast job
$job1 = Get-AdlJob -Account $adlaAccount -JobId 3579dcf0-25ac-4ee7-9971-b2808153c3e4 -Include Statistics
#usual job
$job2 = Get-AdlJob -Account $adlaAccount -JobId 7a8e06e9-0331-4acd-84e1-50837a0420f6 -Include Statistics
- Next, we need a way to easily compare these objects. Jamie has written a great helper function for this here: https://blogs.technet.microsoft.com/janesays/2017/04/25/compare-all-properties-of-two-objects-in-windows-powershell/
- After defining the helper function we can compare the 2 jobs. Let's start by comparing the statistics for the overall job:
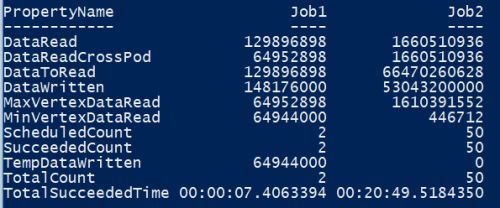
Compare-ObjectProperties $job1.Properties.Statistics.Stages[0] $job2.Properties.Statistics.Stages[0]
We see that for some reason the fast running job has a significantly smaller input size (DataRead). We can investigate our data ingestion pipeline to see if there are some problems there.