Spark Debugging on HDInsight 101
Apache Spark is an open source processing framework that runs large-scale data analytics applications. Built on an in-memory compute engine, Spark enables high performance querying on big data. It leverages a parallel data processing framework that persists data in-memory and disk if needed. This article details common ways of submitting spark applications on our HDInsight cluster and some basic debugging tips.
Prerequisites
- An Azure Subscription: See Get Azure free trial
- A HDInsight cluster: See Get Started with HDInsight on Linux
Sample Scala application
For the scope of this entire article, we will be using a small scala application that does the following tasks:
- Drop a table called “mysampletable” if it already exists
- Create an external table called “mysampletable” which contains the device platform and number of devices using that platform. This table is stored in your WASB storage account’s default container wasb://<default_Container>@<storage_account>/sample/data
- Extract records from hivesampletable include with HDInsight, group them by device platform and write to mysampletable
- Collect all entries from mysampletable and print them.
For the scope of this article we will assume you already have an assembly jar (or "uber" jar) containing our[/your] code and its dependencies. Both sbt and Maven have assembly plugins to create these assembly jars.
Sample Code
Here is the sample Scala code that would be used to accomplish the tasks described above.
Job Submission
There are five ways of submitting spark applications on HDInsight cluster:
- spark-submit
- Livy Batch Job submission
- Interactive Shells [pysparkand spark-shell]
- JupyterNotebooks
- Zeppelin Notebooks
We will cover each of these with details on debugging tips. This article will cover spark-submit and examining log after submitting a job using spark-submit. This following section will be considered as the fundamental and will be referred in subsequent articles discussing the other ways of job submission.
Spark-Submit
Spark applications can be submitted from the headnode of your cluster using the spark-submit script in Spark's bin directory. Once we have an assembled jar we can call the spark-submit script as shown here .
spark-submit --class com.examples. MainExample --master yarn --deploy-mode cluster --executor-memory 15G -- num -executors 6 spark-scala-example-0.0.1-SNAPSHOT.jar
While this command covers some of the most commonly used options for submitting a spark job, for a complete list of options on submitting a job using spark-submit and a detailed deep dive, refer to the below articles.
Examining Console Logs
At various point we will get useful info about the status of the submitted job from the screen.
As soon as the job gets submitted and yarn accepts the job into the queue, it assigns an application ID to the job. You can see the application ID and the job status as highlighted below -
[caption id="attachment_3895" align="aligncenter" width="1024"]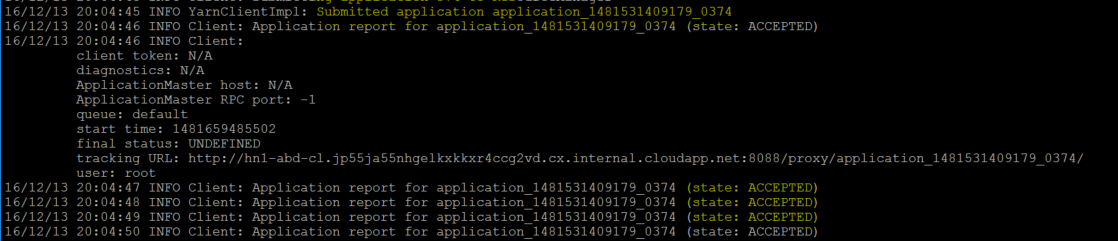 console log for spark-submit: accepted state[/caption]
Once the job reaches running stage, console logs indicate the change in status -
[caption id="attachment_3905" align="aligncenter" width="1024"]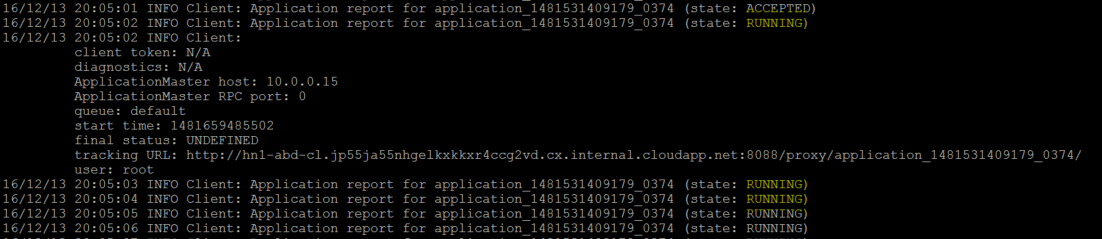 console log for spark-submit: running state[/caption]
Depending on the final status, the job status changes from running to KILLED/FAILED or SUCCEEDED -
[caption id="attachment_3915" align="aligncenter" width="1024"] console log for spark-submit: finished state[/caption]
While this is a certainly useful set of short information about the job, for a more detailed set of logs, we should examine corresponding yarn logs.
Exploring yarn logs
You can access the yarnui using https://<clustername>.azurehdinsight.net/yarnui/ . This gives a list of all applications finished and currently running on the cluster -
[caption id="attachment_3925" align="aligncenter" width="1024"]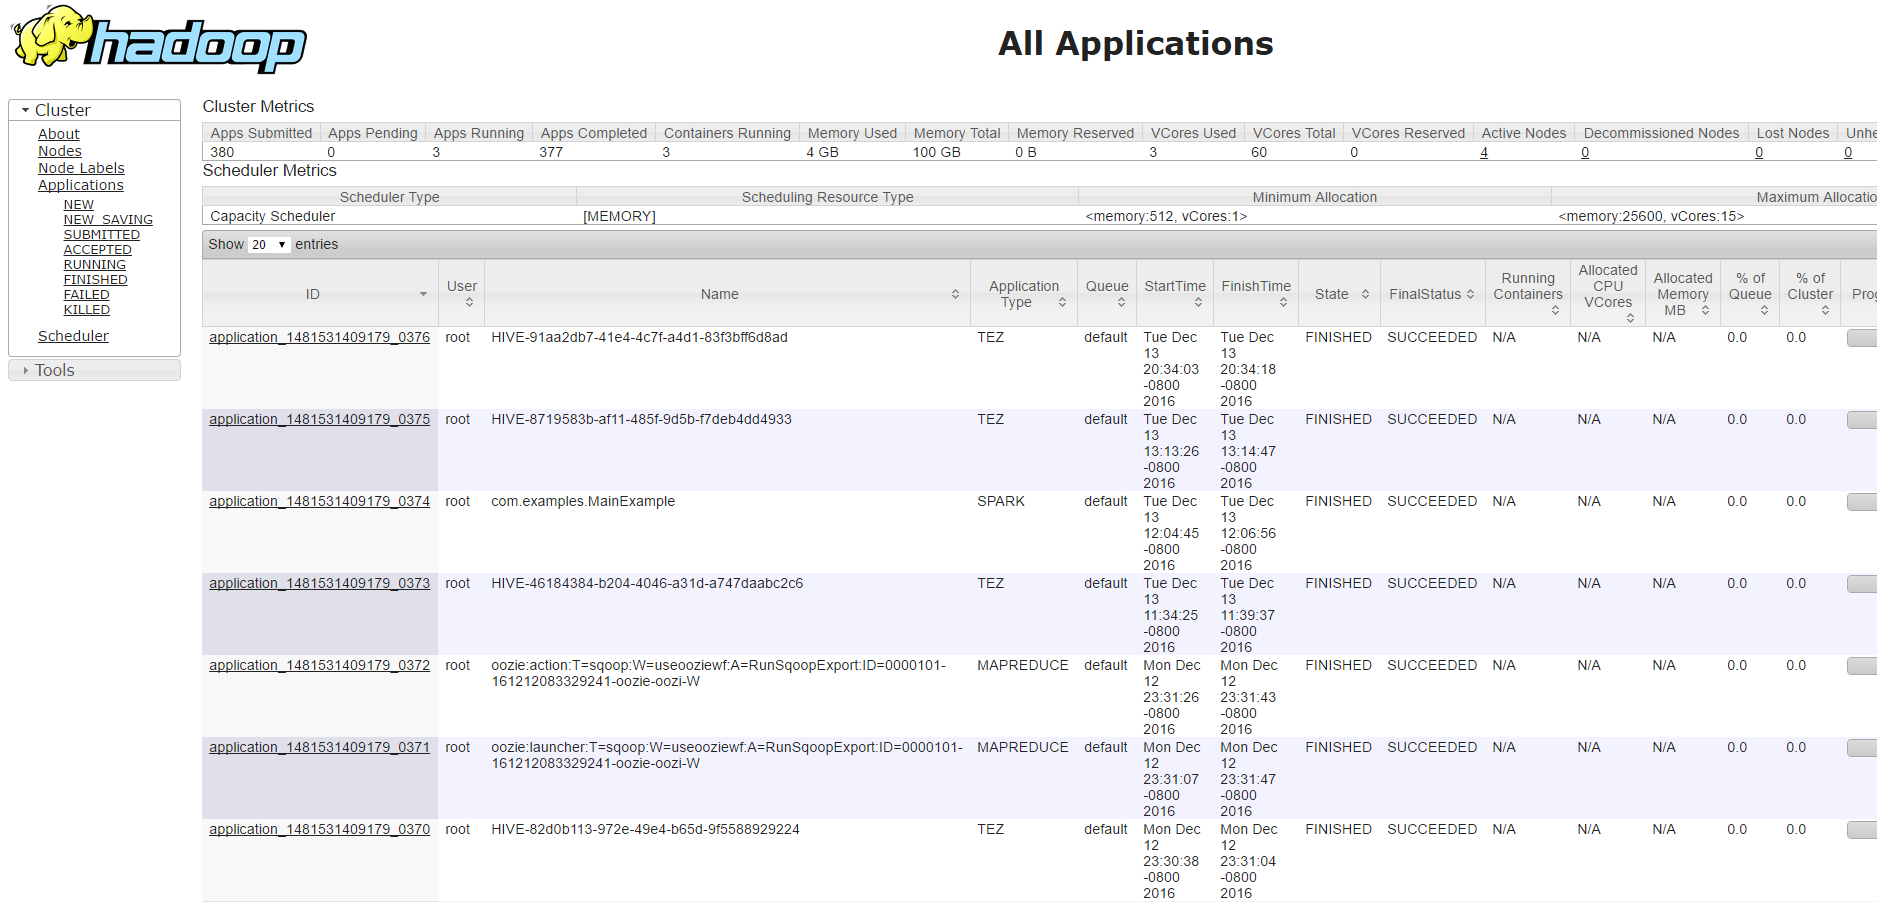 All application list in yarnui[/caption]
From here depending on our interest we can decide to filter down the application from the left menu. For example, if we are interested to see the RUNNING applications we can go to RUNNING tab and find the job we are interested in using its application ID. You can also examine the resource your application is consuming from the same entry -
[caption id="attachment_3935" align="aligncenter" width="1024"]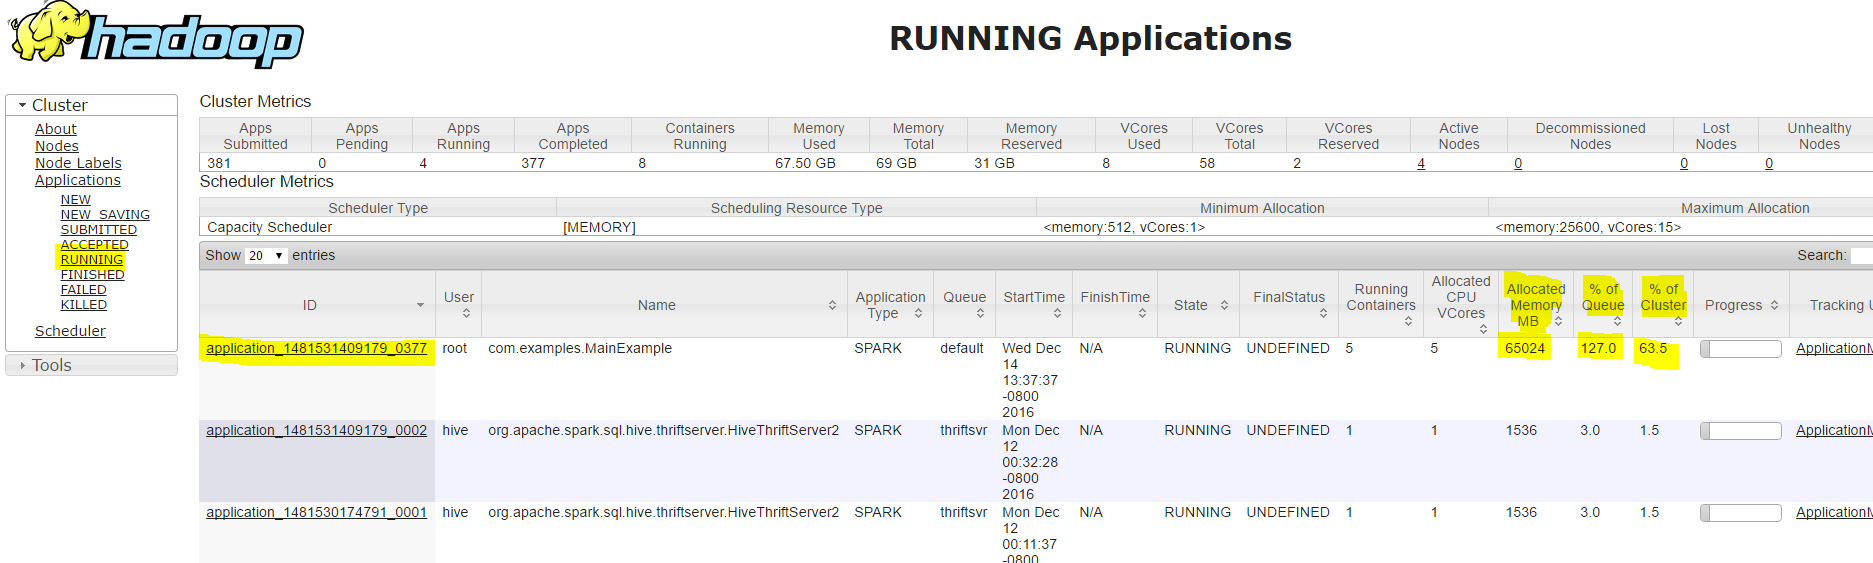 Running application list from yarnui[/caption]
Spark Application Master
To access Spark UI for the running application and get more detailed information on its execution use the Application Master link and navigate through different tabs containing more information on jobs, stages, executors and so on.
[caption id="attachment_4125" align="aligncenter" width="1024"]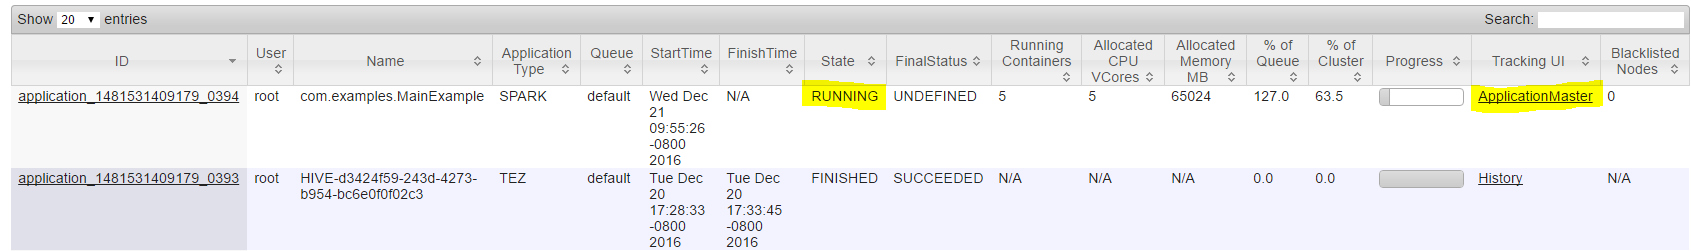 ApplicationMaster Link for RUNNING applications[/caption]
[caption id="attachment_3955" align="aligncenter" width="1024"]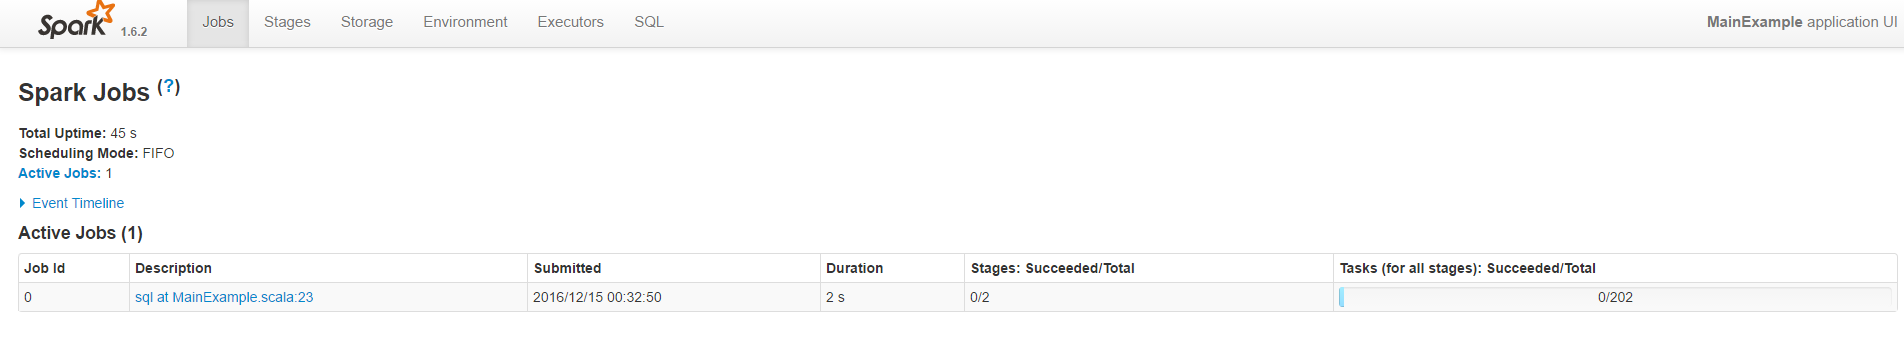 ApplicationMaster link takes the user to Spark UI[/caption]
The Jobs tab lists how your spark job was split into multiple jobs and details on how many tasks each of these job spawned. With the event timeline you can get a visual on the executors with respect to time.
[caption id="attachment_3965" align="aligncenter" width="1024"]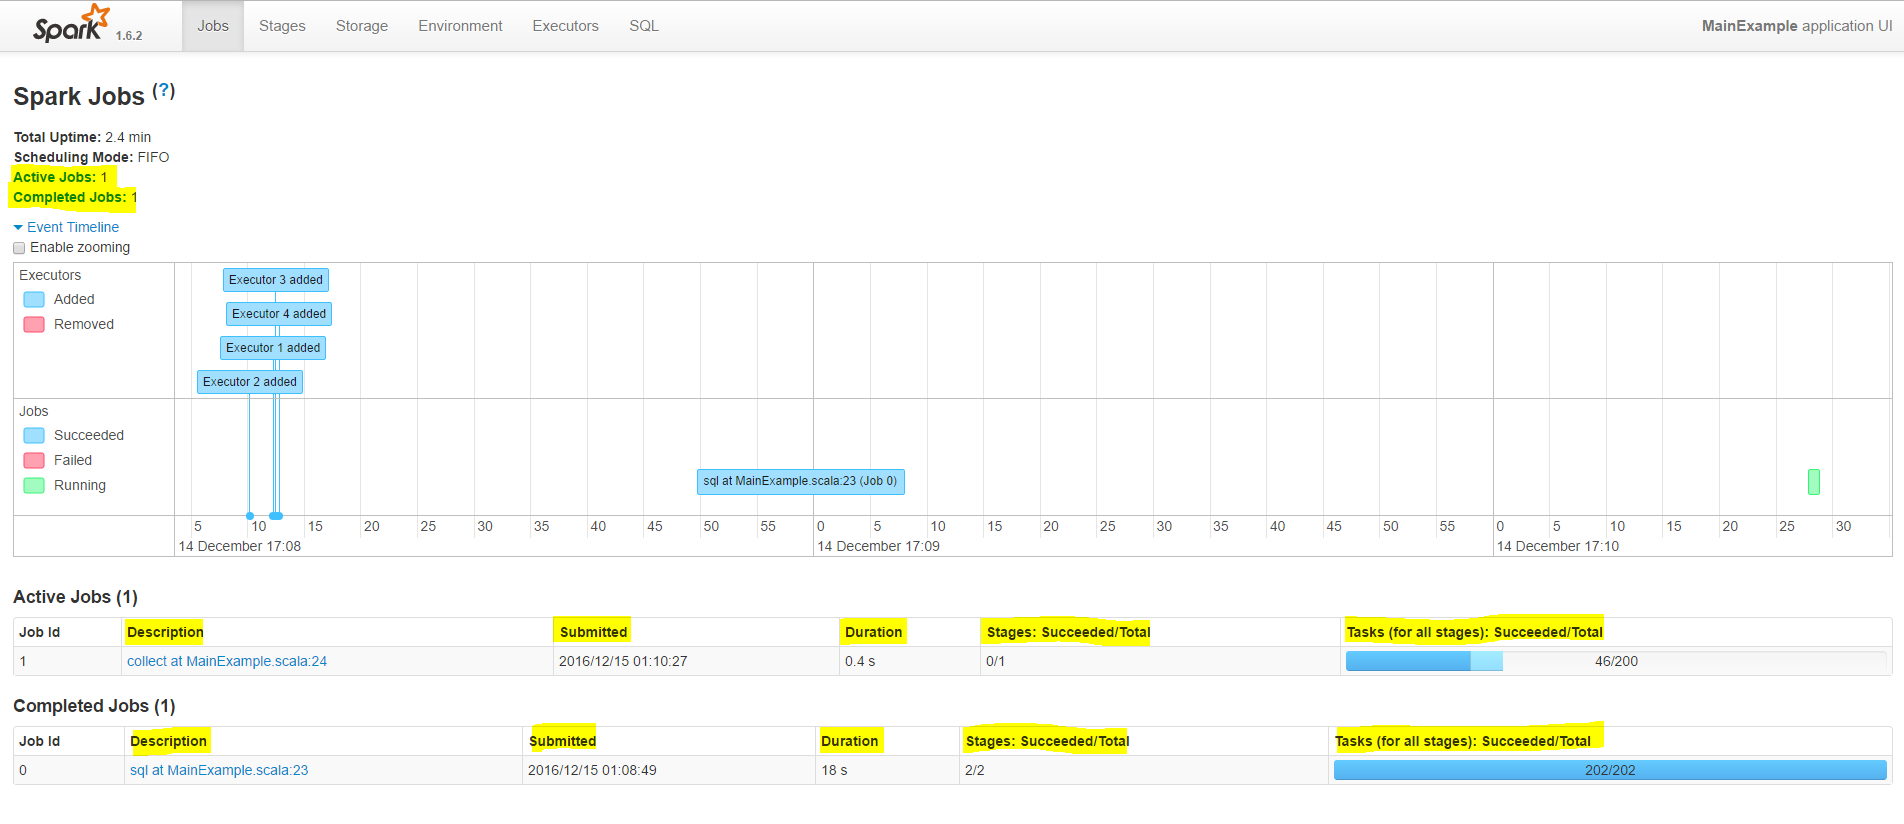 Spark UI - Jobs[/caption]
Further each of these job is split into multiple stages and information about these stages and the pool of resources it used can be obtained from the stages tab.
[caption id="attachment_3975" align="aligncenter" width="1024"]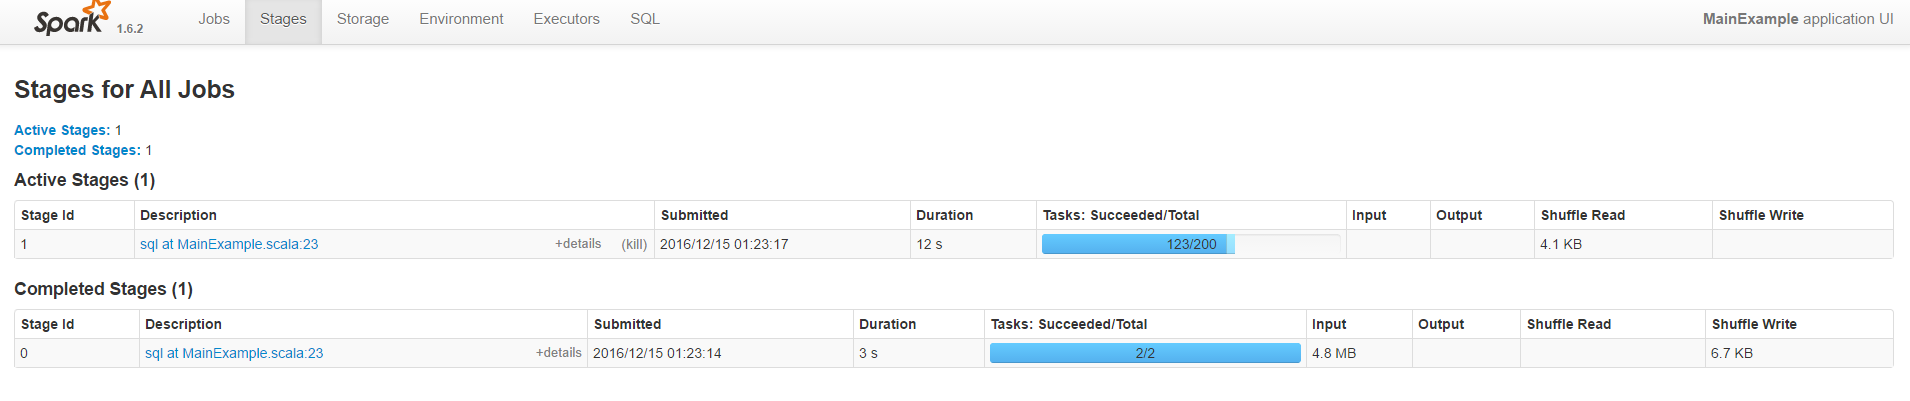 Spark UI -Stages[/caption]
Further by clicking on each of these jobs, you can get information about some of the metrics related to the job and a DAG Visualization which depicts a graph of all the RDD operations that happened in the stage.
[caption id="attachment_3985" align="aligncenter" width="1024"]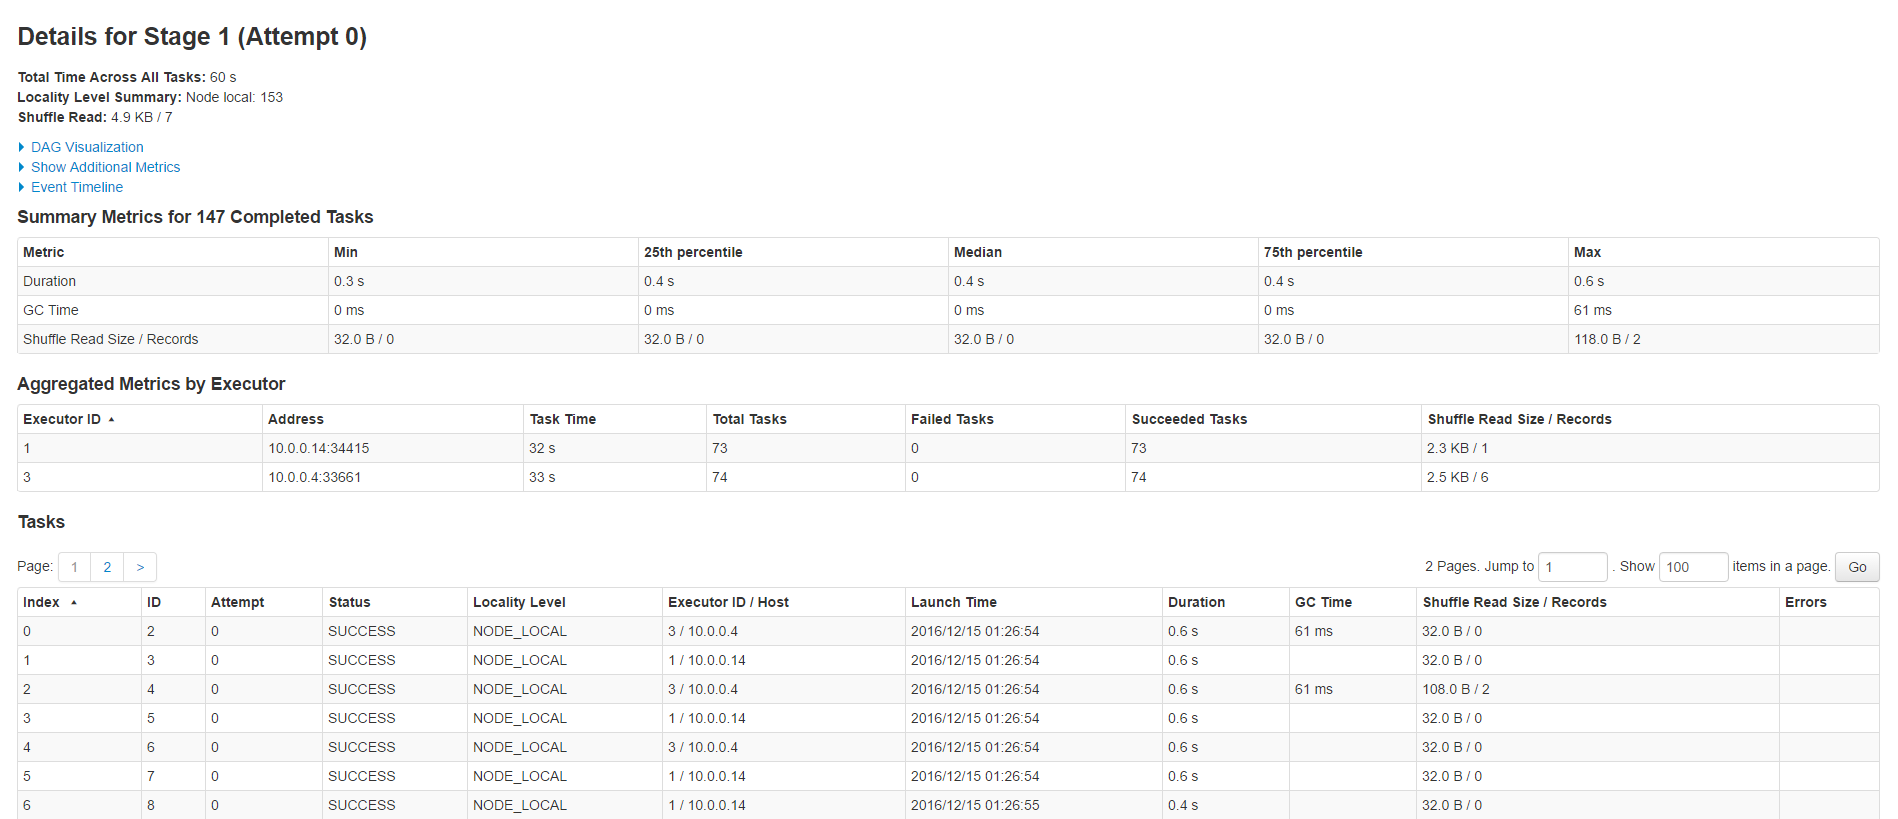 Spark UI - Stages - Job details[/caption]
[caption id="attachment_3916" align="aligncenter" width="438"]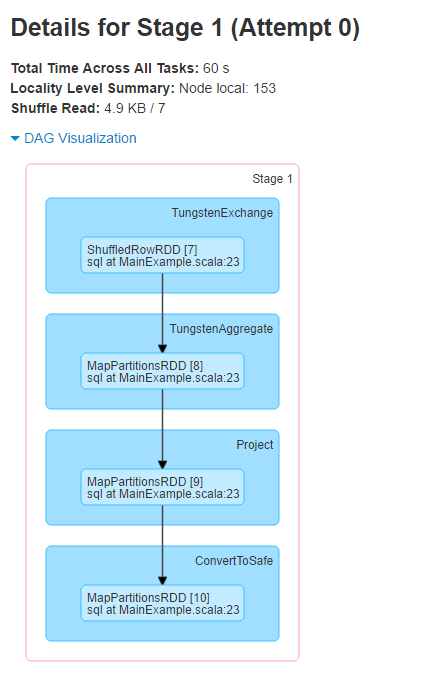 Spark UI - Stages - Job details - DAG[/caption]
A complete list of both user defined and system defined spark properties can be found under the Environment tab.
[caption id="attachment_4005" align="aligncenter" width="1024"]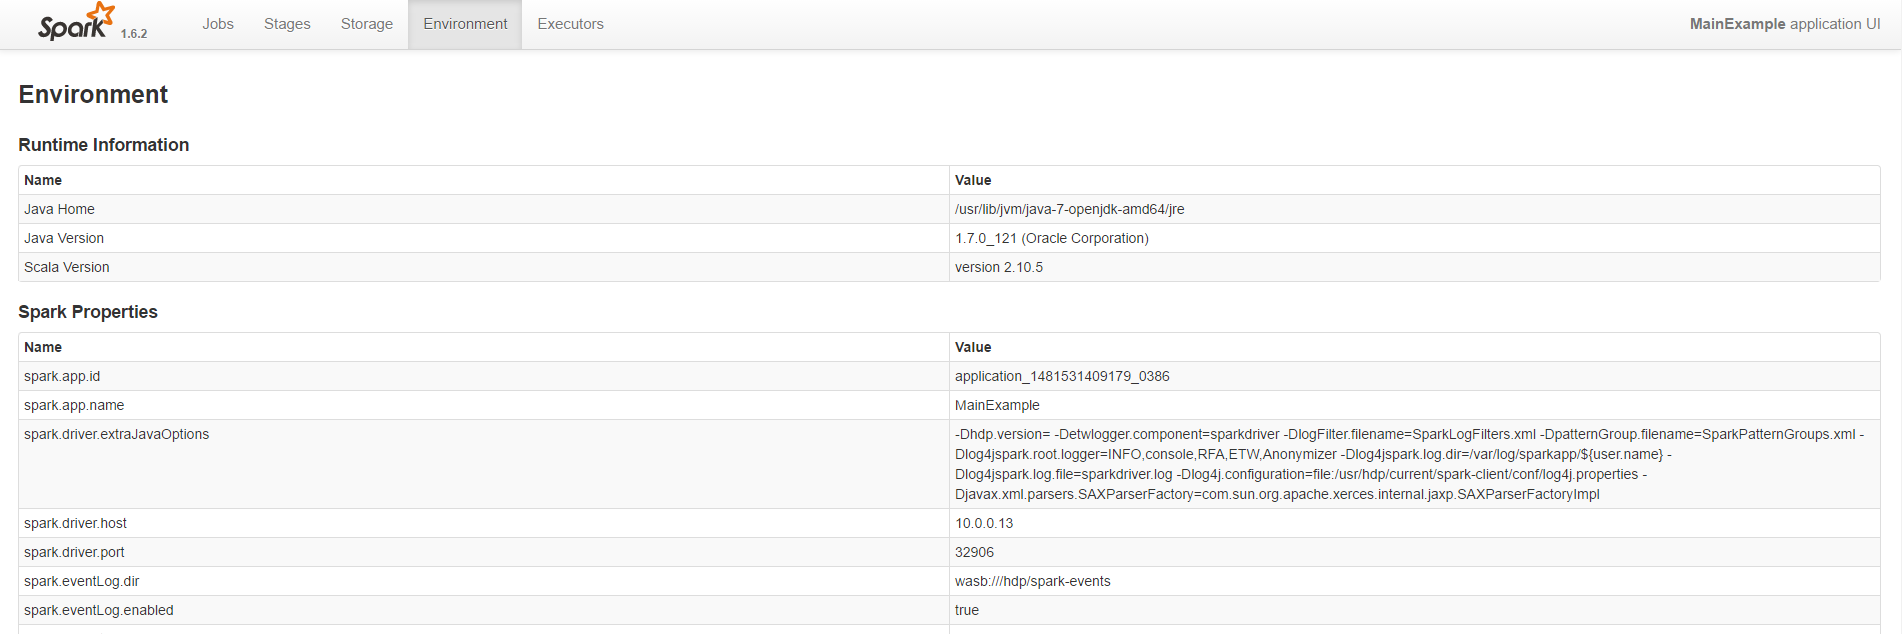 Spark UI - Environment[/caption]
Spark spawns multiple executors to complete each of these stages. Information about each of these executor can be obtained from the executor tab.
[caption id="attachment_4015" align="aligncenter" width="1024"]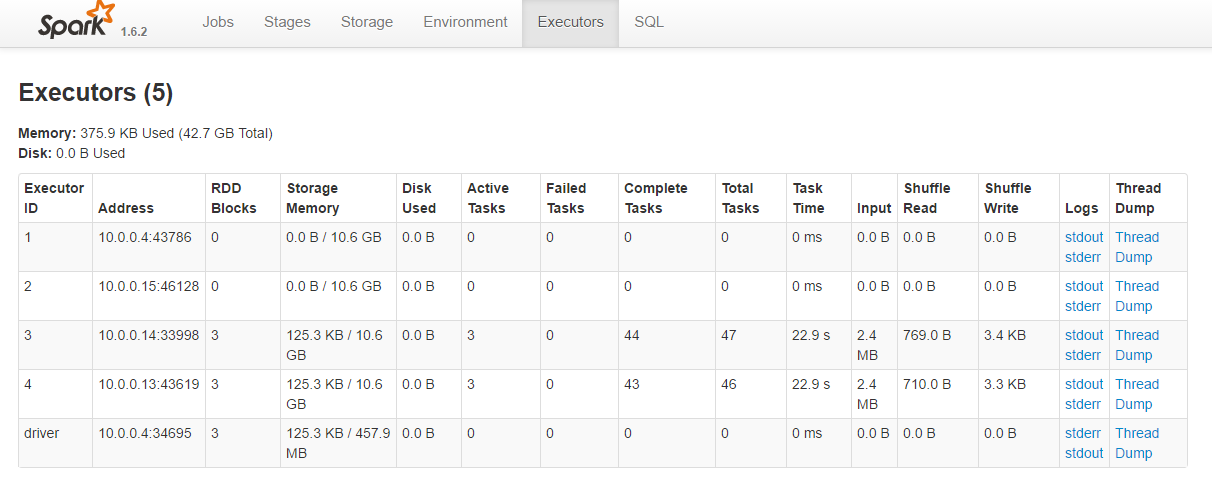 Spark UI - Executors[/caption]
Further to deep dive into more detailed information about the threads running in this executor, use its respective thread dump.
[caption id="attachment_4025" align="aligncenter" width="736"]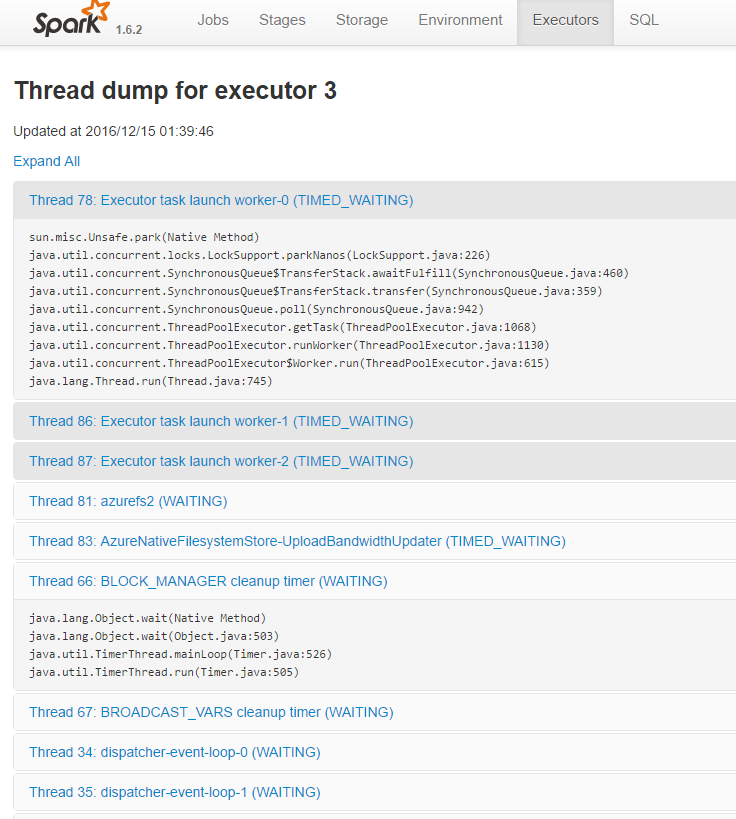 Spark UI - Executors - Thread Dump[/caption]
You can also access executor specific container logs through stdout and stderr
[caption id="attachment_4035" align="aligncenter" width="1024"]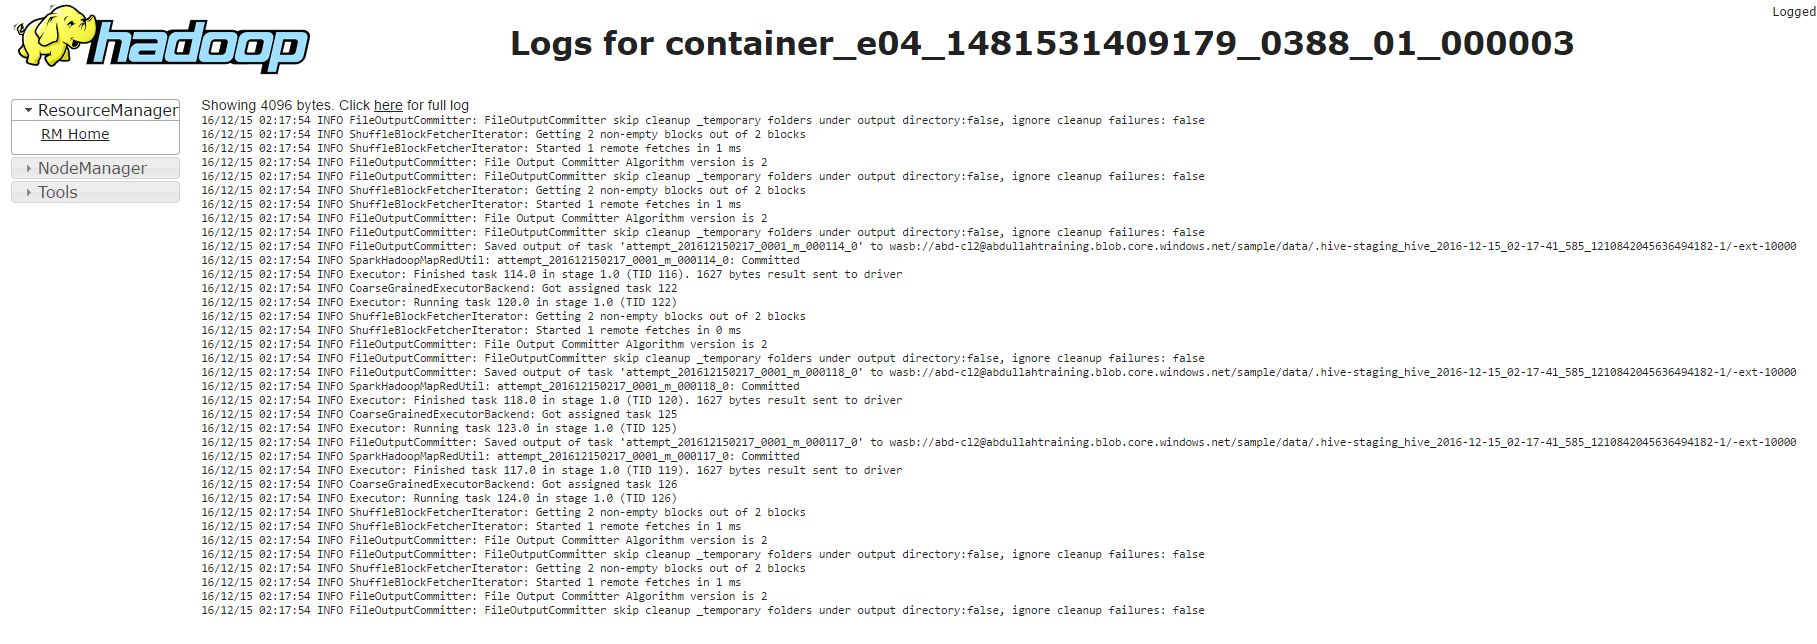 Spark UI - Executors - stderr[/caption]
Yarn Logs
Clicking on the application ID in yarnui takes you to the page that gives a summary of the application execution.
[caption id="attachment_4045" align="aligncenter" width="1024"]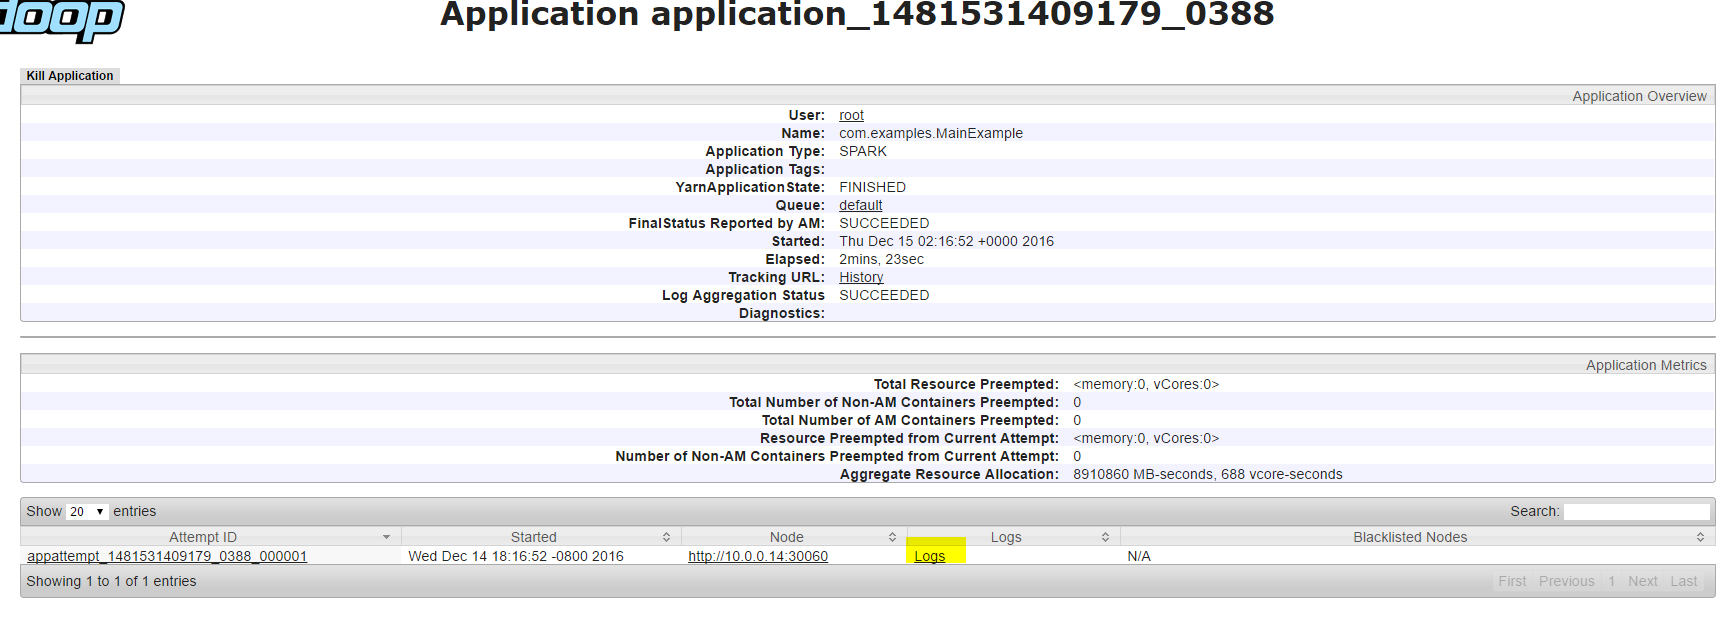 YARN logs[/caption]
The logs link in the above screenshot would take us to a page containing all logs associated to this application. There will be directory info, launch container logs, stderr logs and stdout log with links to full logs for each of them.
The directory.info file shows the local files of the container and where they are cached.
[caption id="attachment_4055" align="aligncenter" width="957"]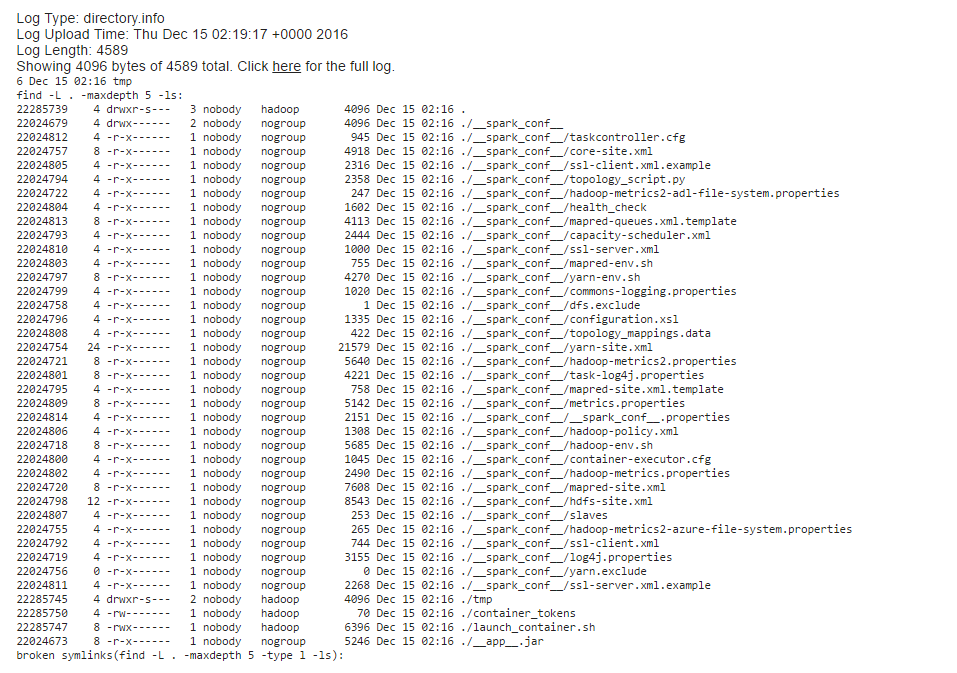 yarn log - directory info[/caption]
Further launch_container.sh scripts details tasks executed in getting the container ready to execute jobs. It primarily does the following tasks:
- Sets environments variables like YARN_LOCAL_DIRS, SHELL, HADOOP_COMMON_HOME, JAVA_HOME etc.
- Sets Classpath and includes all necessary jar files path that are required for running map/reduce task.
- Launches JVM of the YarnChild in which map / reduce task will run.
[caption id="attachment_4065" align="aligncenter" width="1024"]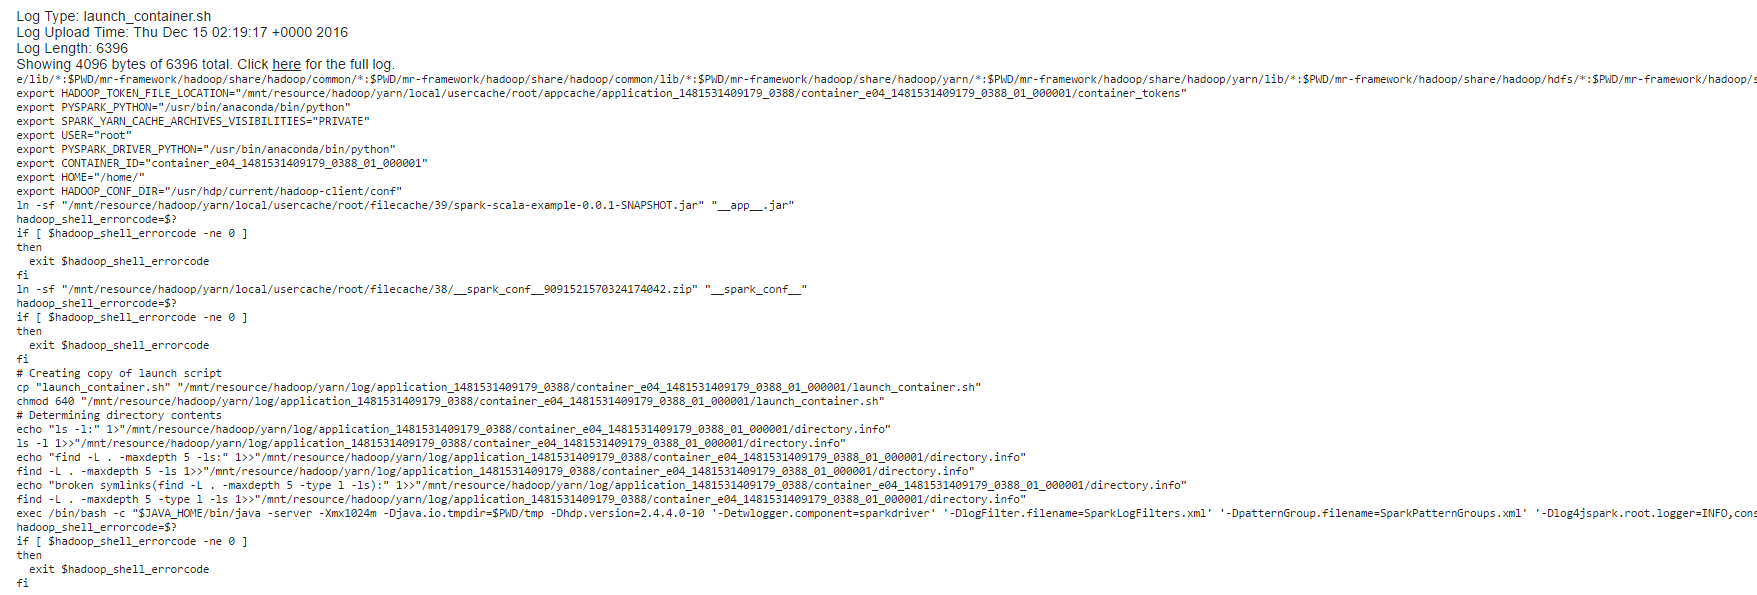 yarn log - launch container[/caption]
Further stdout and stderr indicate output and error logs related to the job.
[caption id="attachment_4095" align="aligncenter" width="1024"]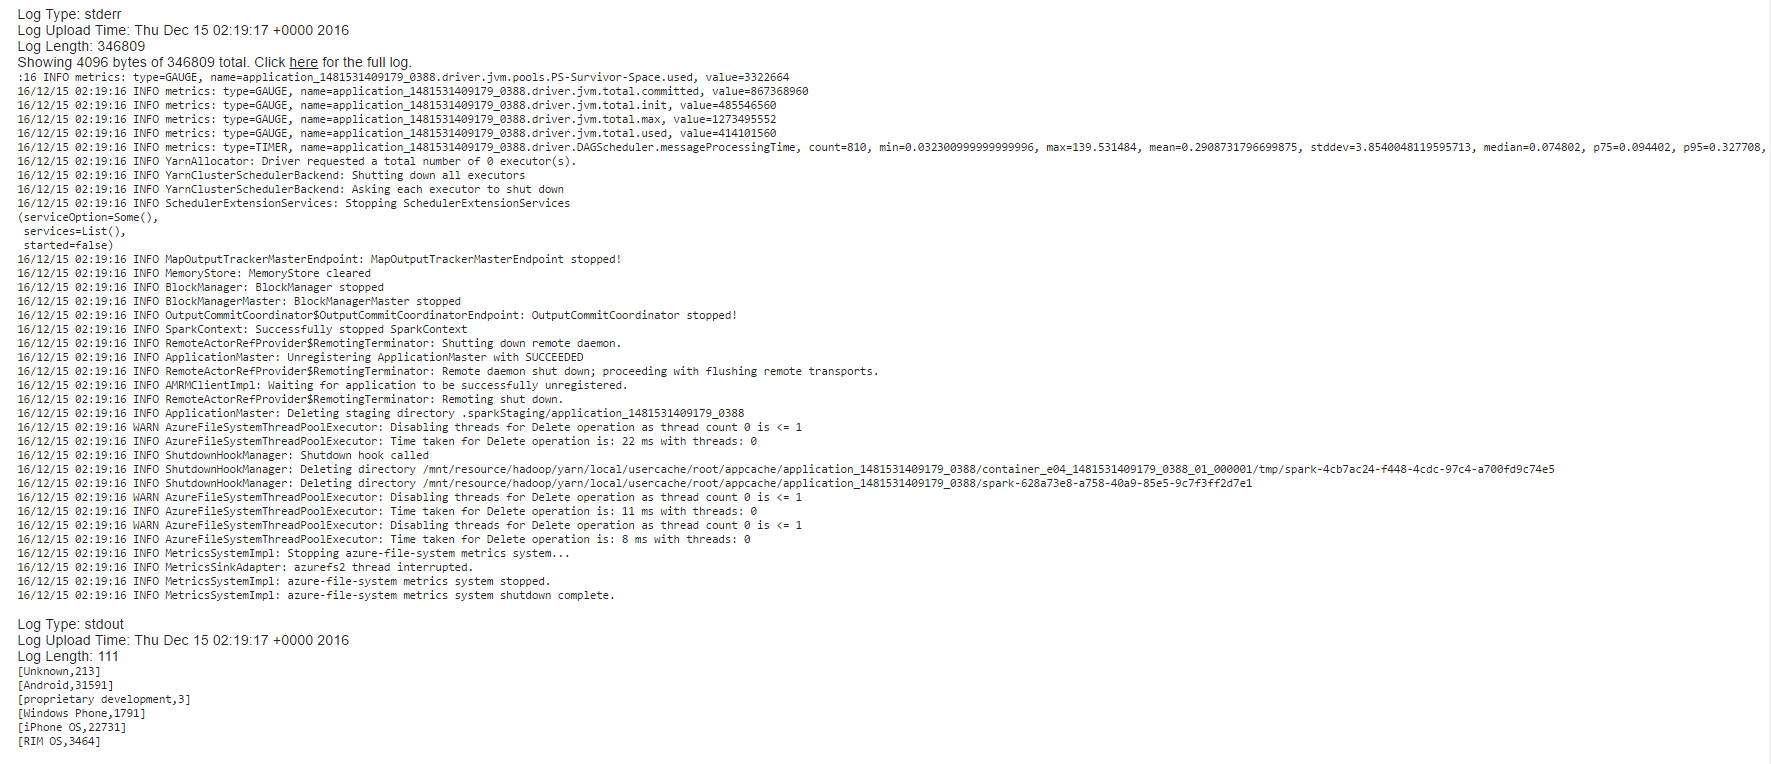 yarn log - stderr and stdout[/caption]
Another way of getting all the relevant logs of an application is to run this command from your headnode -
yarn logs -appOwner <app_owner> -applicationId <app_id> > <some_txt_file>
Example: yarn logs -appOwner hdiuser -applicationId application_1477615200398_0018 > yarnlogs.txt
Spark History
While Application Master provides detailed information about the job that is currently running, to get the same information about completed spark applications we can use - https://<cluster_name>.azurehdinsight.net/sparkhistory
This can come in very handy during debugging errors.
[caption id="attachment_4105" align="aligncenter" width="1024"]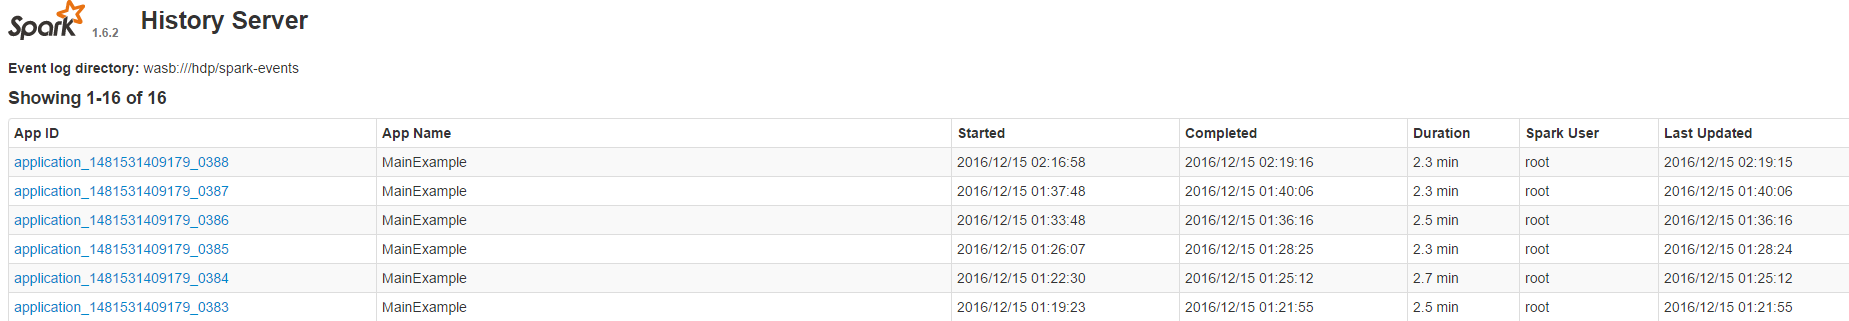 Spark History[/caption]
That's all for today. In subsequent articles we will discuss about other ways of job submission and how to examine some additional logs for debugging.
Related Articles
This is the second part of this Spark 101 series - Spark Job Submission on HDInsight