Saving Spark Streaming Metrics to PowerBI
- The sample Jupyter Scala notebook described in this blog can be downloaded from https://github.com/hdinsight/spark-jupyter-notebooks/blob/master/Scala/EventhubsSparkStreamingToPowerBI.ipynb.
- Spark PowerBI connector source code is available at https://github.com/hdinsight/spark-powerbi-connector.
This blog is a follow-up of our two previous blogs published at https://blogs.msdn.microsoft.com/azuredatalake/2016/03/09/saving-spark-dataframe-to-powerbi/ and https://blogs.msdn.microsoft.com/azuredatalake/2016/03/09/saving-spark-dataframe-to-powerbi/ to show how to save Spark DataFrame and RDD to PorwerBI using the Spark PowerBI connector. In this blog we describe another way of using the connector for pushing Spark Streaming metrics to PowerBI as part of a Spark interactive or batch job through an example Jupyter notebook in Scala which can be run on an HDInsight cluster. The usage of the Spark PowerBI connector with Spark Streaming is exactly similar to that with Spark DataFrame and RDD, however, the difference is in the actual implementation of the method that aligns DStream and PairedDStream with PowerBI table schema. While using the Spark PowerBI connector be aware of the limitations of PowerBI REST APIs as detailed in https://msdn.microsoft.com/en-us/library/dn950053.aspx.
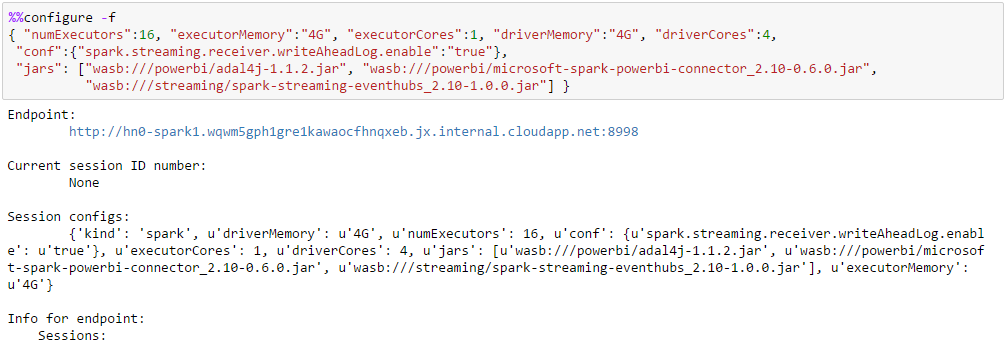
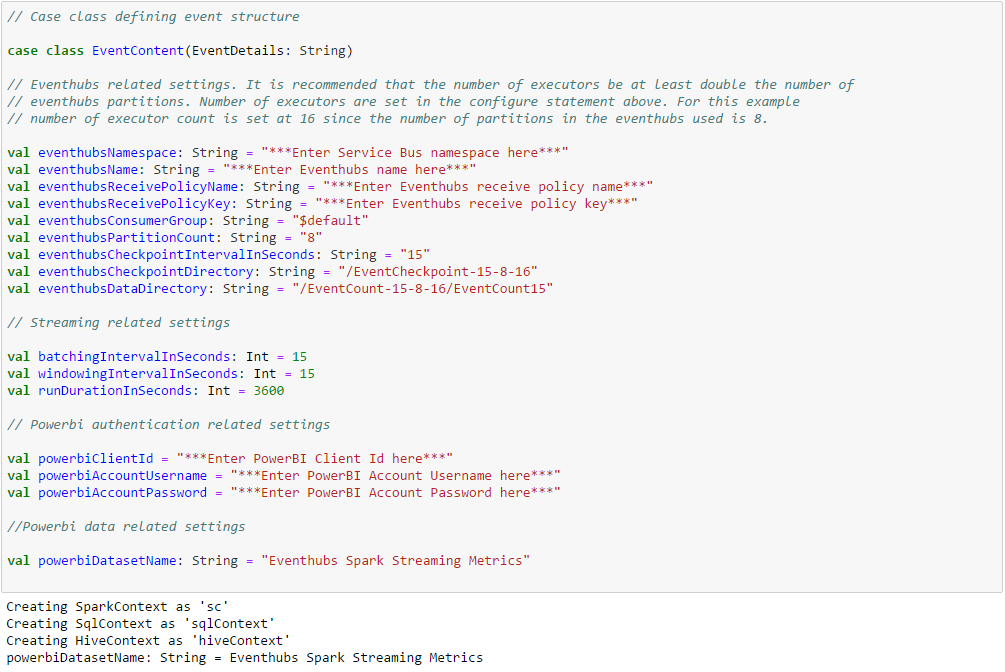
To work with this example Microsoft Service Bus Eventhub needs to be set up following the steps described at https://azure.microsoft.com/en-us/documentation/articles/hdinsight-apache-spark-eventhub-streaming/. This example shows how to monitor two Spark streaming metrics, one natural and another derived. The natural metric is the count of events received per batching interval and the derived metric is the total count of events received so far maintained through a stateful key-value pair using updateStateByKey. To start with this example we need to configure Jupyter to use two external JARs and place them in a known folder in the default container of the default storage account of the HDInsight cluster:
- adal4j.jar available at https://mvnrepository.com/artifact/com.microsoft.azure/adal4j
- spark-powerbi-connector_2.10-0.6.0.jar (compiled with Spark 1.6.1) available at https://github.com/hdinsight/spark-powerbi-connector. Follow the README for Maven and SBT co-ordinates.
This streaming example also needs an additional JAR to be placed in the driver and executor class paths. This is the Spark Eventhubs receiver JAR already available in the cluster, since we will be using Eventhubs as the flow control service in this Spark Streaming example.
- spark-streaming-eventhubs_2.10-1.0.0.jar (compiled with Spark 1.6.1) available at https://github.com/hdinsight/spark-eventhubs. Follow the README for Maven and SBT co-ordinates. Alternatively the same JAR named differently as spark-streaming-eventhubs-example-1.6.1.2.4.2.0-258-jar-with-dependencies.jar or equivalent can be picked up from /usr/hdp/current/spark-client/lib from any of the cluster nodes.
If required, source codes from Github repositories can be cloned, built and packaged into appropriate JAR artifacts through IntelliJ. Refer to the appropriate section of the Azure article at https://azure.microsoft.com/en-us/documentation/articles/hdinsight-apache-spark-eventhub-streaming/ for detailed instructions.
Define a case class EventContent that conforms to and will hold the event data which will be received from the Eventhub. Enter or update the relevant information pertaining to your Eventhub and PowerBI setups.
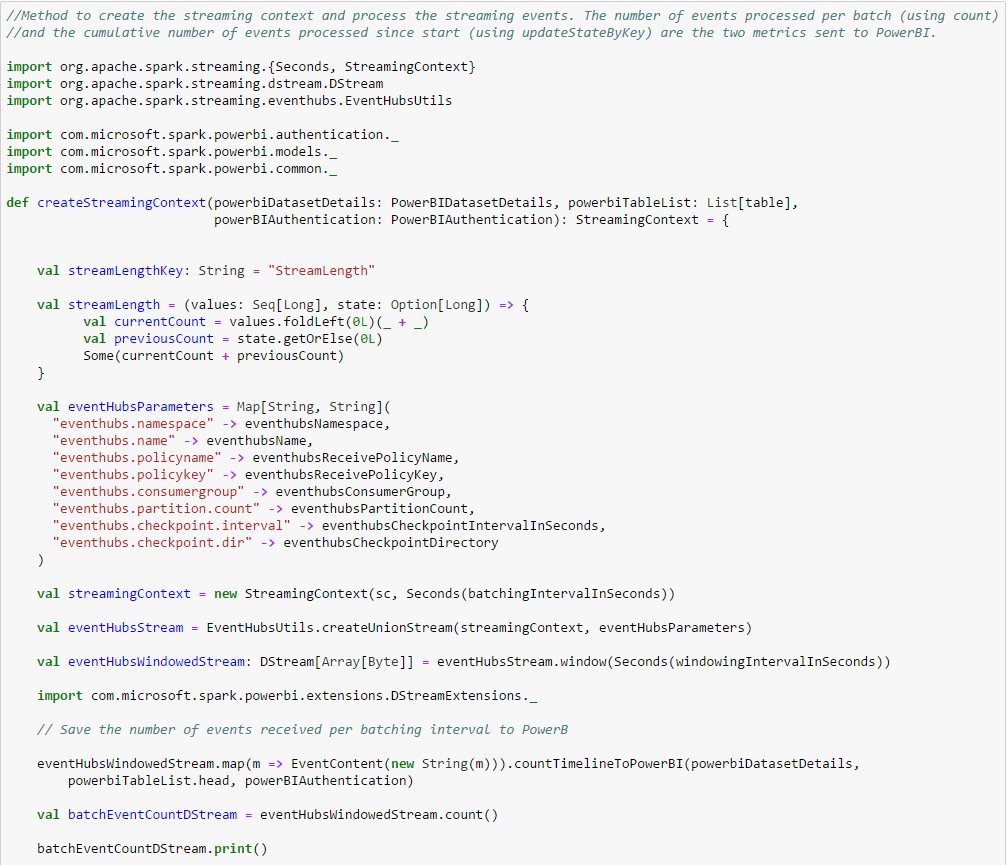
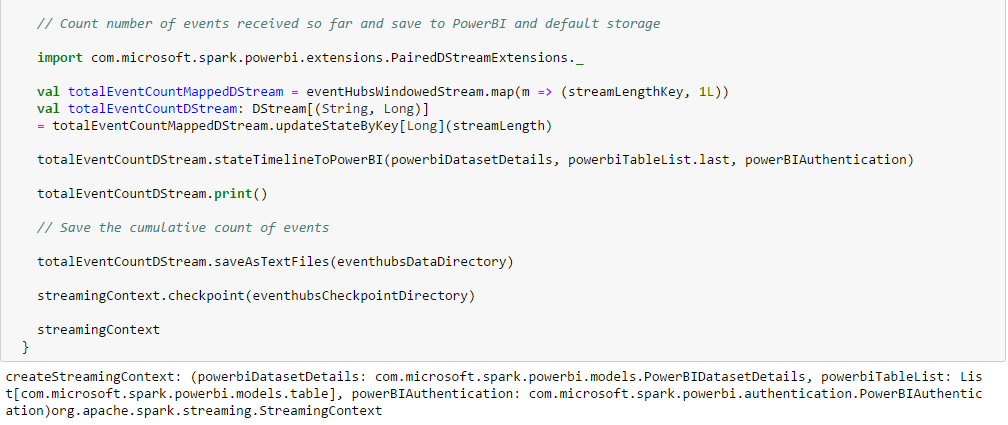
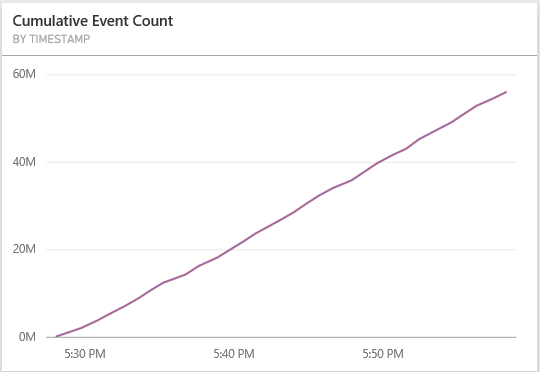
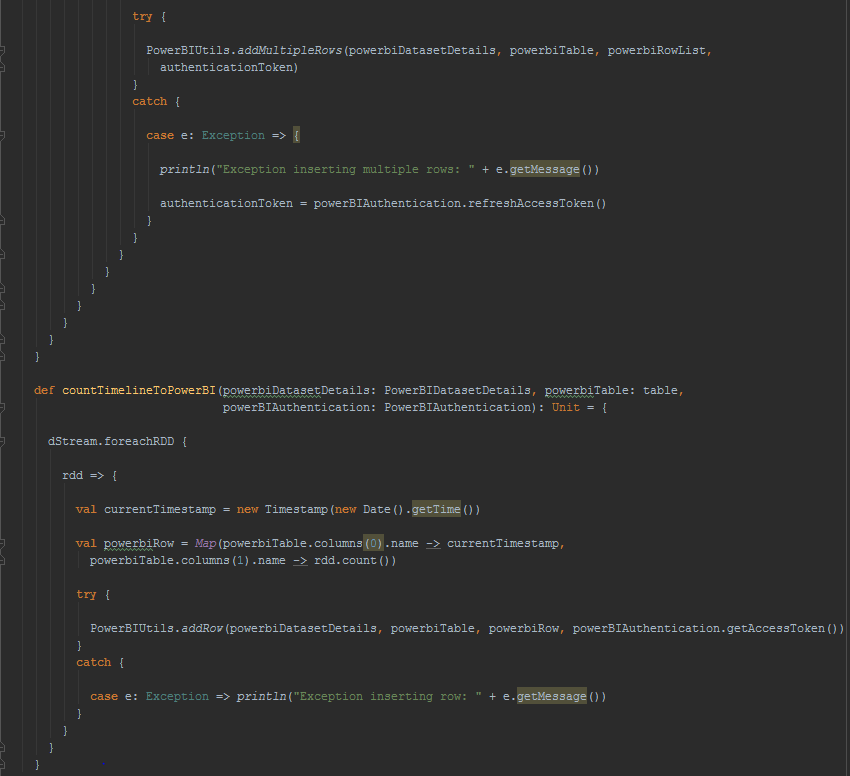
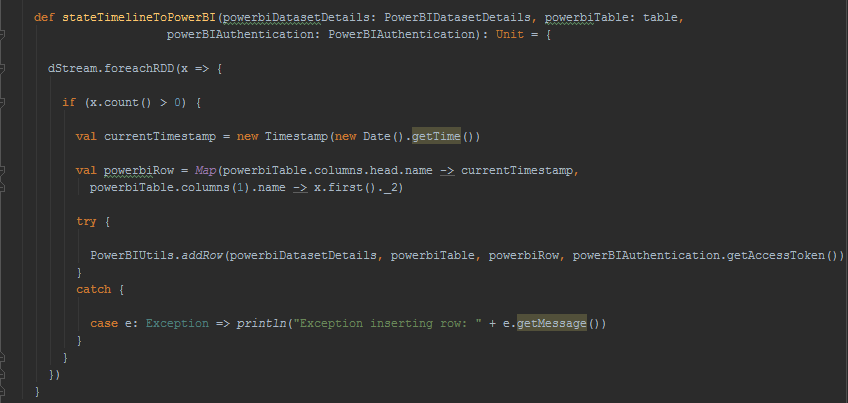
Most of the work is done in the createStreamingContext function. It sets up the Eventhub parameters, creates the streaming context and sets up the stateful parameter that maintains the count of events received since start. The countTimelineToPowerBI method on DStream sends to PowerBI the number of events received per batch. The stateTimelineToPowerBI method on PairedDStream can be used to send any stateful parameter to PowerBI at the end of each batch interval. In this example, it is used to send the cumulative count of events received since start.
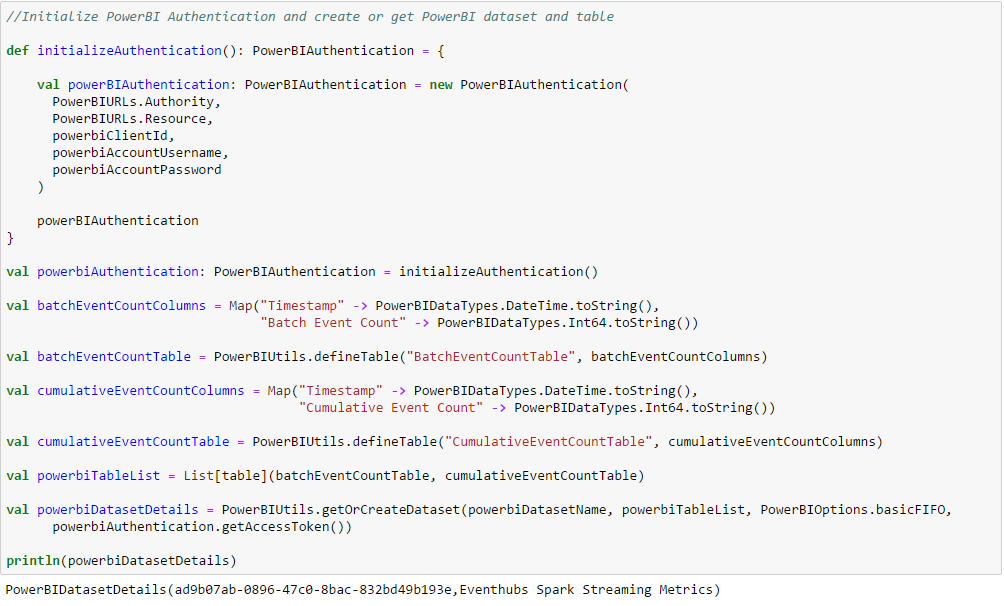
Initialize the PowerBIAuthentication object, declare PowerBI table with column names and datatypes and create (or get) the dataset containing the table. This step runs in the driver and actually goes to PowerBI and creates (or gets) the dataset and the underlying table(s). PowerBI table column names should match field names of the case class underlying the RDD which it is storing.
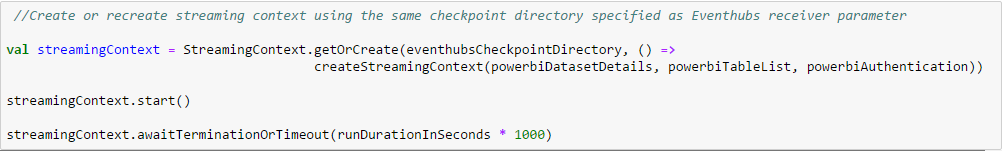
Get or create the StreamingContext and run it for 1 hour (for example).
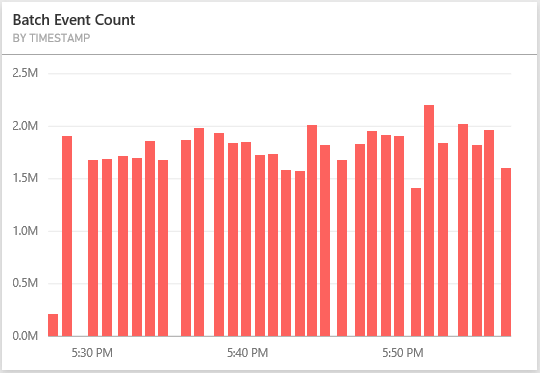
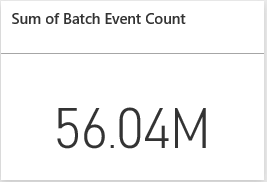
Verify that the data is actually saved and can be displayed on a live PowerBI dashboard with the view refreshed at regular interval.
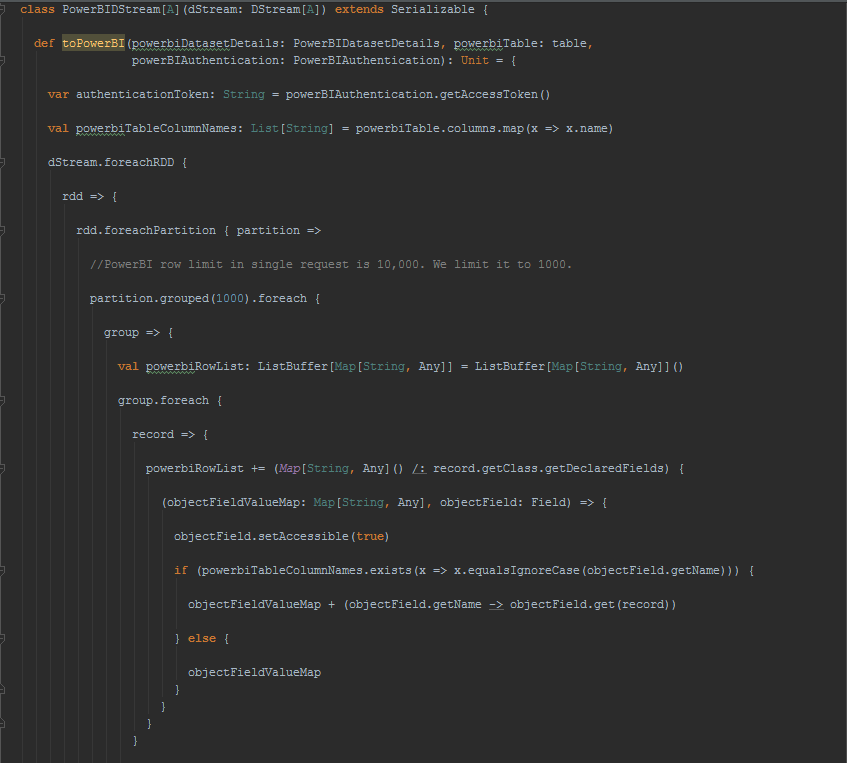
For further reading into how DStream has been extended to support saving it to PowerBI, following is the code behind. Each partition of each RDD in the DStream is grouped into 1000 records and serialized into multiple rows POST request to PowerBI table in JSON format. The field names are extracted from the RDD records and PowerBI table rows are populated with the columns whose names match the field names. The other method available to the DStream extension is for displaying the timeline of the count of records in the DStream which comes useful for showing metrics for long running Spark jobs like Spark Streaming.
PairedDStream used for storing streaming state has been extended to save the timeline of the change of state to PowerBI.
[Contributed by Arijit Tarafdar]