Saving Spark Distributed Data Frame (DDF) To PowerBI
- The sample Jupyter Scala notebook described in this blog can be downloaded from https://github.com/hdinsight/spark-jupyter-notebooks/blob/master/Scala/SparkDataFrameToPowerBI.ipynb.
- Spark PowerBI connector source code is available at https://github.com/hdinsight/spark-powerbi-connector.
Data visualization is often the most important part of data processing as it can surface up data patterns and trends in data that cannot be otherwise easily perceptible by humans. PowerBI (https://powerbi.microsoft.com/en-us/) is a powerful data visualization platform offered by Microsoft. As PowerBI turned out to be a natural choice for data visualization we developed a Spark to PowerBI connector (https://github.com/hdinsight/spark-powerbi-connector) which implements a PowerBI REST client and extension methods on Spark DataFrame, RDD and DStream in the same way described in a previous blog https://blogs.msdn.microsoft.com/azuredatalake/2016/03/01/extending-spark-with-extension-methods-in-scala-fun-with-implicits/. These extension methods can be called in a Spark application in codes that run either in the driver or the executors.
This blog describes one of the ways of using the connector for pushing Spark DataFrame to PowerBI as part of a Spark interactive or batch job through an example Jupyter notebook in Scala which can be run on an HDInsight cluster. To learn about how to deploy Azure HDInsight Linux Spark cluster and launch Jupyter notebook refer to the Azure article at https://azure.microsoft.com/en-us/documentation/articles/hdinsight-apache-spark-jupyter-spark-sql/. PowerBI has always been able to pull data from various data sources including those supported by Spark (like Hive table, Azure blob, SQL server) through appropriate drivers but the Spark to PowerBI connector enables pushing data from Spark directly to PowerBI. Though this example shows pushing an entire DataFrame directly to PowerBI, it is expected that users should use their judgment on the amount of data to be pushed through the DataFrame. Be aware of the limitations of PowerBI REST APIs as detailed in https://msdn.microsoft.com/en-us/library/dn950053.aspx. An ideal use case will be displaying some metrics or aggregates of a job at certain intervals or stages as PowerBI Dashboard.
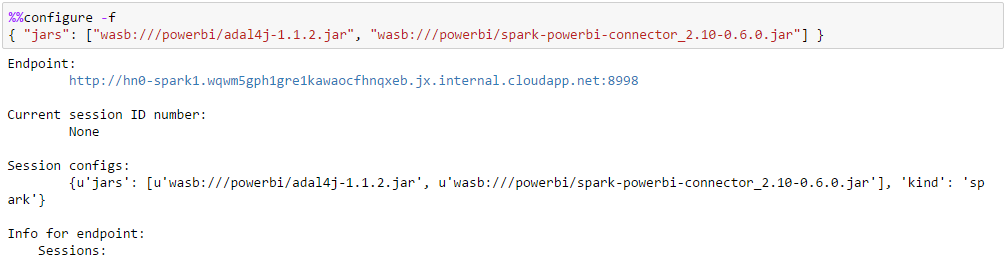
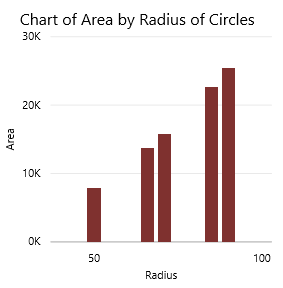
In this example we will visualize a DataFrame on PowerBI that displays the relation between the radius and area of circles. To start with this example we need to configure Jupyter to use two additional JARs and place them in a known folder in the default container of the default storage account of the HDInsight cluster:
- adal4j.jar available at https://mvnrepository.com/artifact/com.microsoft.azure/adal4j
- spark- powerbi-connector_2.10-0.6.0.jar (compiled with Spark 1.6.1) available at https://github.com/hdinsight/spark-powerbi-connector. Follow the README for Maven and SBT co-ordinates.
If required, source codes from Github repositories can be cloned, built and packaged into appropriate JAR artifacts through IntelliJ. Refer to the appropriate section of the Azure article at https://azure.microsoft.com/en-us/documentation/articles/hdinsight-apache-spark-eventhub-streaming/ for detailed instructions.
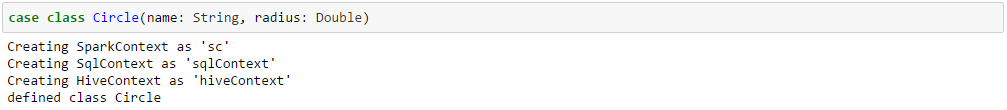
Define a case class Circle that will hold the data which will be used to create the DataFrame for this example. In practice the DataFrame data source can be anything that is supported by Spark.
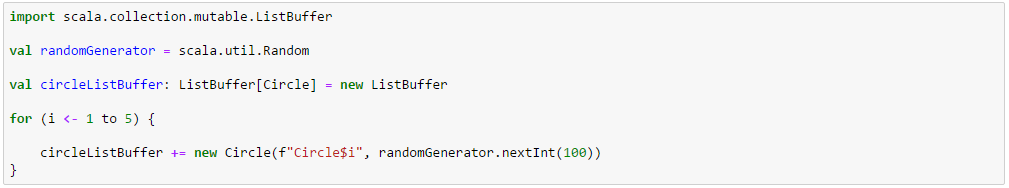
Generate a list of Circle objects and create a DataFrame out of it.
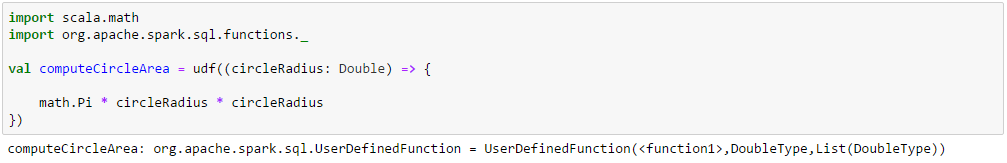
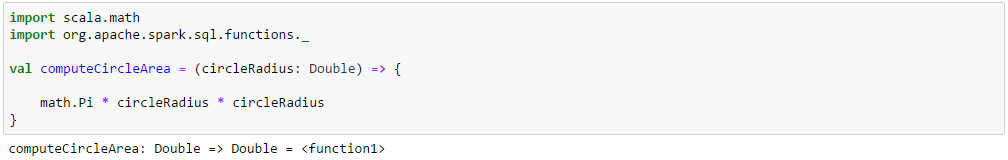
 Declare a user defined function with radius as the input parameter to compute the area of a circle.
Add an additional column “area” to hold the areas of the circles. 
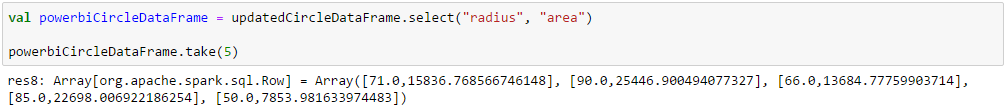
Create a new DataFrame by selecting only the columns from the last DataFrame which we want to show on the PowerBI dashboard. In this example columns “radius” and “area” are selected.
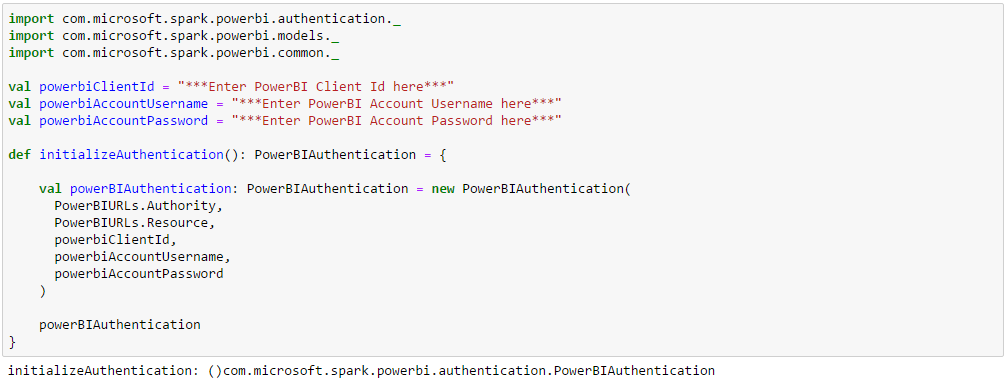
Enter the PowerBI Client ID, PowerBI Account Username and PowerBI Account Password and declare a PowerBIAuthentication object. The PowerBIAuthentication class is defined in the spark-powerbi-connector.jar under com.microsoft.spark.powerbi.authetication.
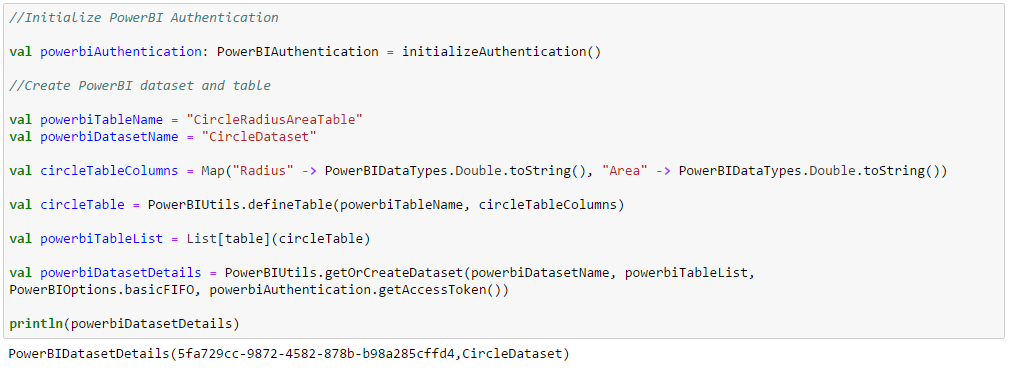
Initialize the PowerBIAuthentication object, declare PowerBI table with column names and datatypes and create (or get) the PowerBI dataset containing the table. This step runs in the driver and actually goes to PowerBI and creates (or gets) the dataset and the underlying table(s). The column order of the PowerBI table should match that of the DataFrame which it is storing.
Simply call the toPowerBI method on the DataFrame with PowerBI dataset details received when creating (or getting) the dataset in the previous step, the PowerBI table name and the PowerBIauthentication object.

Verify that the data is actually saved and can be displayed on the PowerBI dashboard.
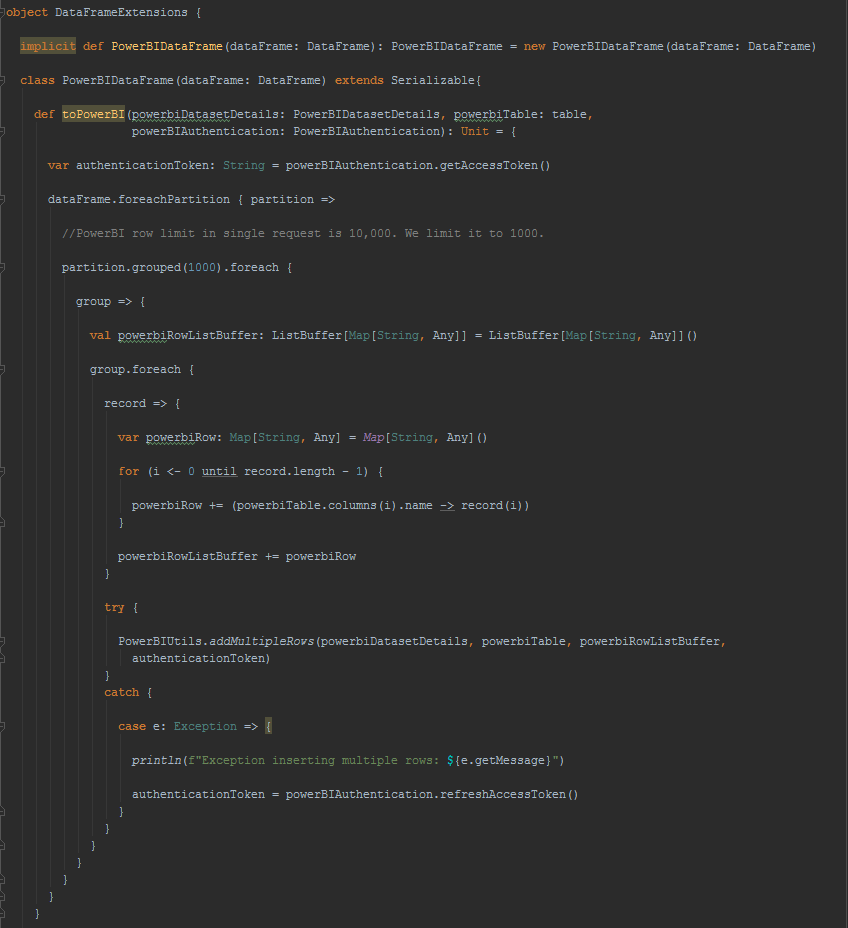
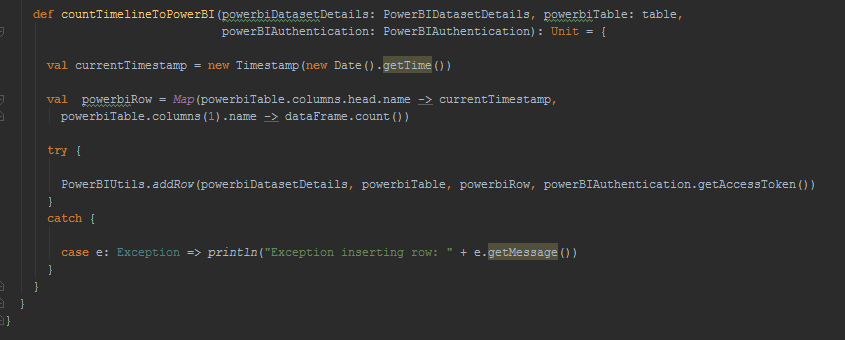
For further reading into how DataFrame has been extended to support saving it to PowerBI, following is the code behind. Each partition of the DataFrame is grouped into 1000 records and serialized into a POST request of multiple rows to PowerBI table in JSON format. Since DataFrame and PowerBI table both maintain column order and PowerBI table and DataFrame column orders should match, no name matching is done between columns of DataFrame and PowerBI table.
[Contributed by Arijit Tarafdar]