Choosing the right Kubernetes object for deploying workloads in Azure - Part 5
This material has been added to a full eBook, Kubernetes Objects on Microsoft Azure.
Introduction
This post will cover running a front-end service that will connect with the SQL Server back-end you created in the last post. This front-end is an ASP.Net Core application.
Considerations for deployment
My previous posts covered various deployment options. Out of those deployment options, horizontalpodautoscaler is an option suitable for workloads that have variable resource demands. Front-end services are a good example of such workloads. Depending upon appropriate metrics, they need to be scaled up or down. This post will cover deploying an ASP.Net Core front-end as a horizontalpodautoscaler. This post will demonstrate scaling up and down, based on CPU utilization percentage, which is an arithmetic mean of the pod's CPU utilization. However, this raises an interesting question. How do we know the CPU utilization of a pod? This is where monitoring a Kubernetes cluster becomes important. This monitoring is enabled by a tool (such as Heapster), which collects metrics from each node. These metrics are used for scaling up and down operations. In Azure, Heapster can be set up to run together with InfluxDB (a time-series database) and Grafana (a dashboarding solution), as described below.
Installing Heapster with InfluxDB and Grafana
This process involves following steps:
- Clone the heapster github repo.
- Change the grafana.yaml file.
- Create the services.
Some more details on each step are below. Depending upon the level of customization you need, see the articles, How to Utilize the "Heapster + InfluxDB + Grafana" Stack in Kubernetes for Monitoring Pods and Deploying Heapster to Kubernetes.
Clone the heapster github repo
This step involves getting the latest code base. Any tool, such as GitHub Desktop, can be used to do the clone. Once the cloning is complete, navigate to the path heapster\deploy\kube-config\influxdb. This is where the YAML files exist for the three components.
Change the grafana.yaml file
It's possible to customize the dashboard setup using this file. In my case, I changed it to use Azure Load Balancer, as well as commenting environment variables that are not needed for the production setup. See Figure 1.
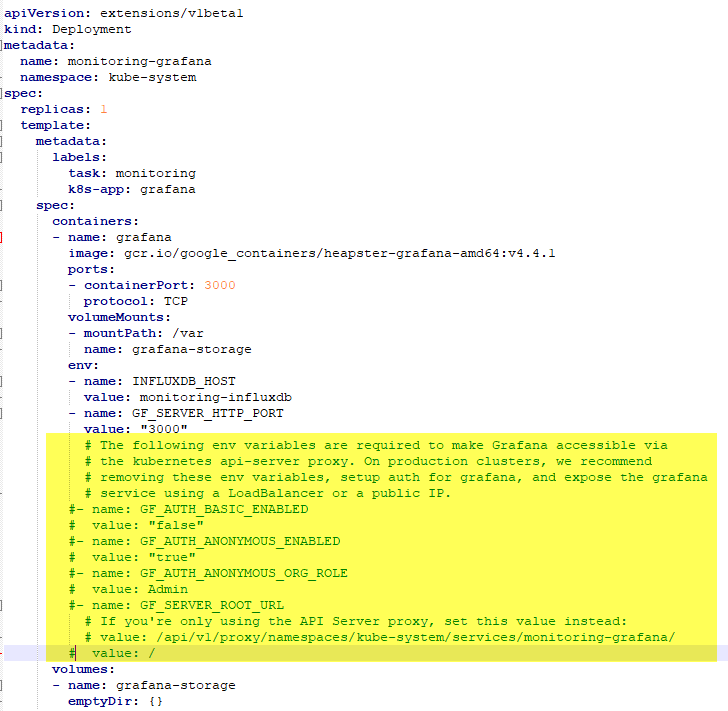
Figure 1. Customizing Grafana.
Next, you will specify a public static IP address (see Figure 2) that is different than the one you used for creating the SQL Server service (see my previous post).
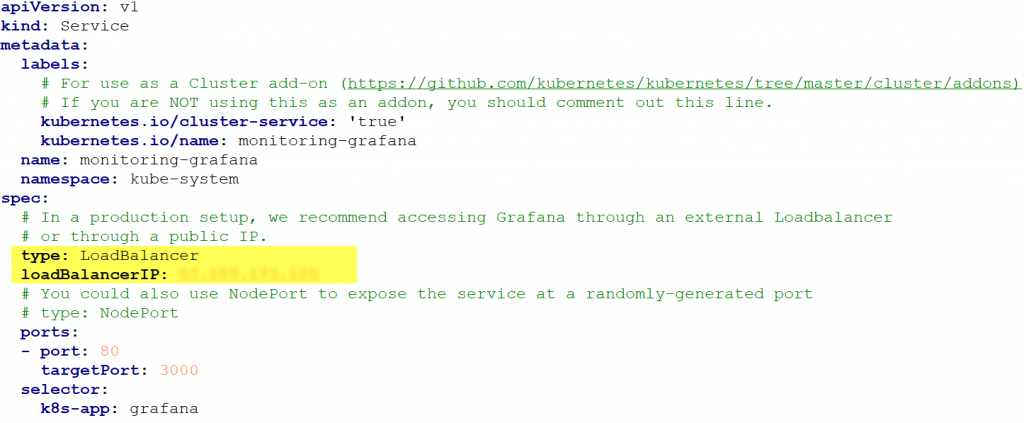
Figure 2. Specifying a public static IP address.
Create services
This step involves running kubectl from a location where the three YAML files exist, as shown in Figure 3.
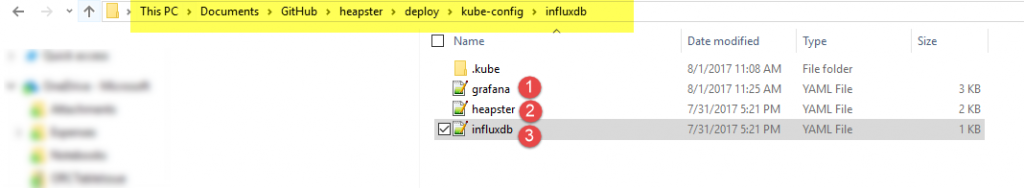
Figure 3. The three YAML files in one folder.
Run the kubectl create -f
. command (see Figure 4) to create all the components, as mentioned, in all the YAML files found in the location shown in Figure 3.
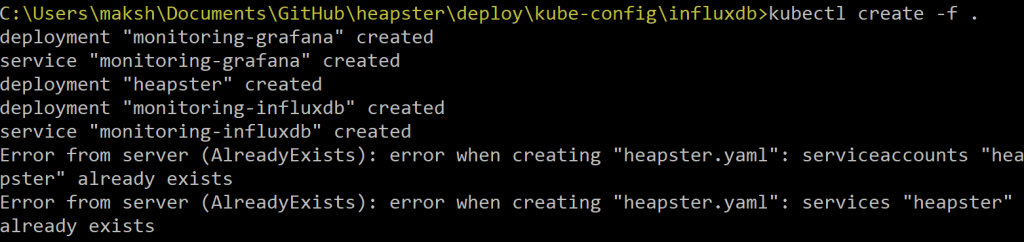
Figure 4. Running the kubectl create -f. command.
Navigate to the Kubernetes dashboard again and verify that all the services are created and running. Make sure you change the value in the Namespace drop-down box to All namespaces (see #1 in Figure 5), because new services are created in the kube-system namespace.
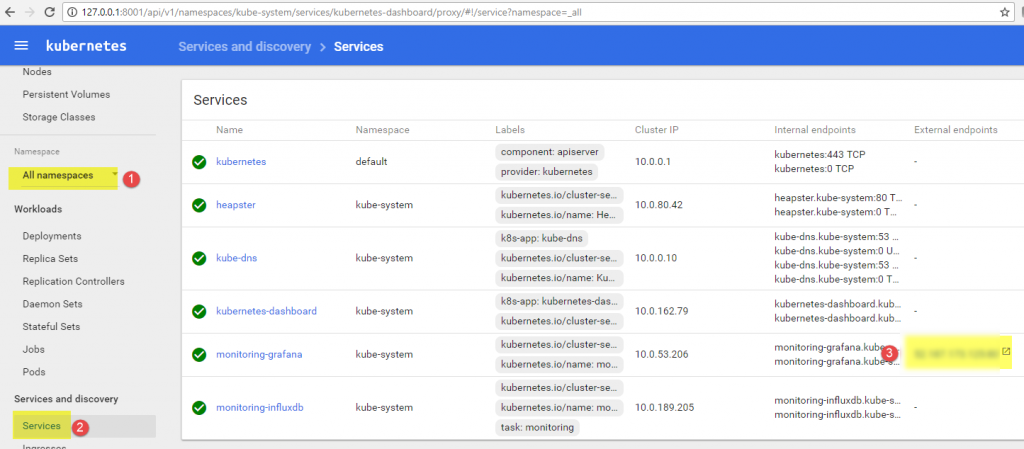
Figure 5. Ensuring the Namespace value is set to All namespaces.
Note that the external endpoint for the Grafana service should be the Azure IP address (see #3 in Figure 5). Click the link to navigate to the Grafana dashboard (see Figure 6).
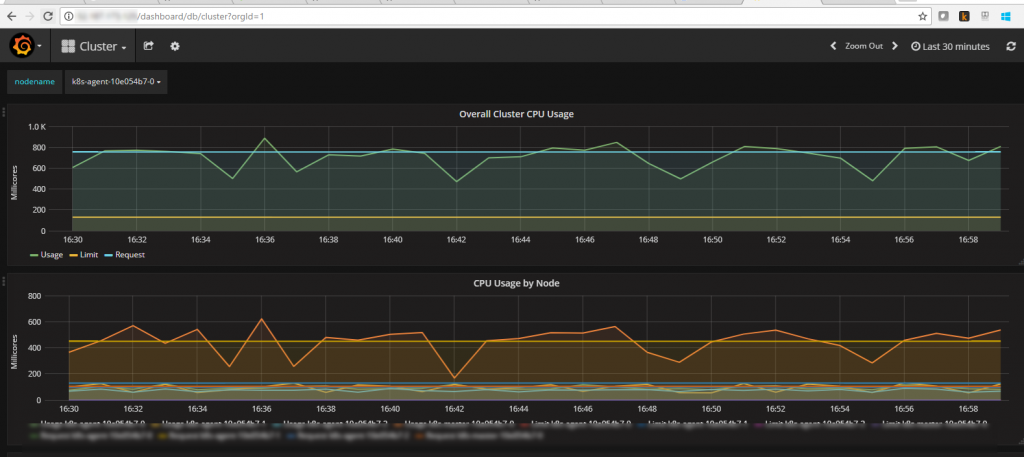
Figure 6. The Grafana dashboard.
The Kubernetes dashboard is now displaying the resource utilization information for the cluster as well as for pods.
Creating HorizontalPodAutoscaler
Instead of creating and scaling pods or a container by itself, horizontalpodautoscaler uses a deployment or replication controller or replica set to create pods. It simply scales using these deployment resources.
Creating Deployment
A deployment resource uses a custom docker image of an ASP.Net Core application that connects with SQL Server, as mentioned in my blog post here. An ASP.Net Core application uses connectionstring, pointing to <External IP Address of SQL Service, 1433> as the data source. See the five settings in Figure 7.
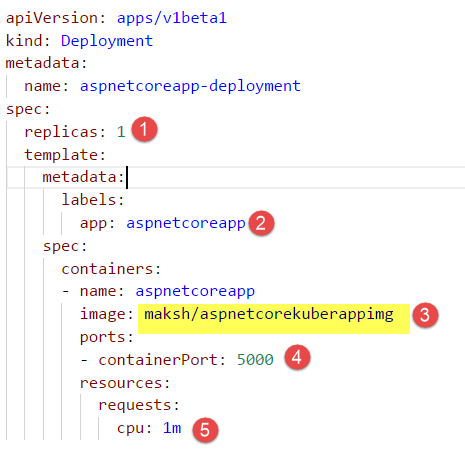
Figure 7. Creating a deployment resource.
Creating Service
While deployment will ensure pods are created and are maintained to a replica number, as specified in replicas, service addresses problems associated with dynamic IP addresses that are assigned to pods when they crash and are re-created by the deployment. A service has a static IP address that makes it possible to use it to reach an application, regardless of any failures of the underlying pods. See the two settings in Figure 8.
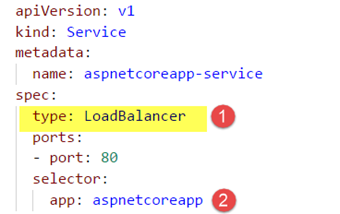
Figure 8. Creating a service resource.
Note that the type specified as LoadBalancer (in Figure 8) ensures that an LB and associated IP address gets generated in Azure when this service is created. It also uses the selector value app: aspnetcoreapp, which also matches with the deployment definition. It means that this service will include all those pods that have the labels app: aspnetcoreapp.
Creating HorizontalPodAutoScaler
Finally, a horizontalpodautoscaler will use the deployment resource and specify the scale up rules. See the settings in Figure 9.

Figure 9. Creating a horizontalpodautoscaler resource.
Note that it targets deployment
aspnetcoreapp-deployment. The rules are specified using min and max
replicas and are associated with targetCPUUtilizationPercentage.
All three of these resources (deployment, service, and horizontalpodautoscaler) can be defined in a single YAML file and can be created in a single command execution. See Figure 10.

Figure 10. Defining the three resources in a YAML file.
Deployment replicas can be queried using the command shown in Figure 11.

Figure 11. Querying the deployment replicas.
HorizontalPodAutoScaler is now set up to increase the number of pods to two if the CPU utilization increases over 20%. Note that the Replicas number is at 1, meaning only 1 pod is currently running.
General troubleshooting
Sometimes, Kubernetes doesn't display the current CPU utilization. This known issue is documented here. A solution to solve this problem is documented here.
Verifying scaling operation
Deployment is now set to increase the number of pods if the CPU utilization goes above 20%, due to any activity. Note the current number of replicas by running the command in Figure 12.

Figure 12. The kubectl get deployment command.
This shows that with the current CPU load of 0%, only 1 pod is needed to run, and it is running.
Now, launch the application by hitting the external URL, and in a new command window, launch another parallel workload, as shown in Figure 13.

Figure 13. Launching another parallel workload.
The command in Figure 13 generates a CPU load. It generates a pod and starts running with increasing CPU utilization. After a while, the CPU utilization of this pod, as well as the ASP.Net Core pod, starts to increase.
Run the command in Figure 14 to verify it.

Figure 14. Running the kubectl get hpa command.
Note that the current CPU utilization is now more that 20%. Horizontalpodautoscaler should kick in an additional replica, as specified in its manifest.
Verify this by running the command in Figure 15.
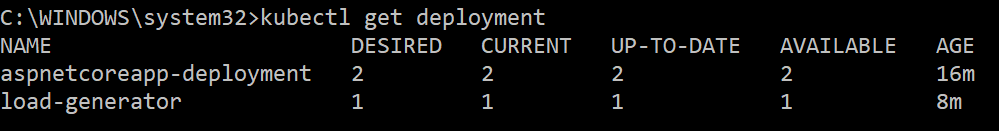
Figure 15. Running the kubectl get deployment command.
Notice that the DESIRED replica count has jumped to 2, as specified in the manifest. Service is now running with 2 pods, as shown in Figure 16.
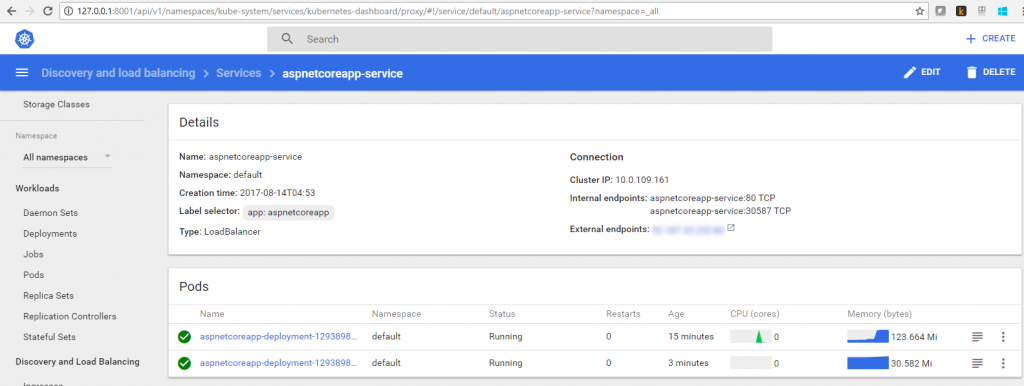
Figure 16. The service is now running with two pods.
Next, stop the load-generator deployment and ASP.Net Core application as well. After a while, note the CPU utilization again. See Figure 17.

Figure 17. Running the kubectl get hpa command again.
This should bring down the replica count back to 1. See Figure 18.
Figure 18. Running the kubectl get deployment command again.
Service should also run with 1 pod. See Figure 19.
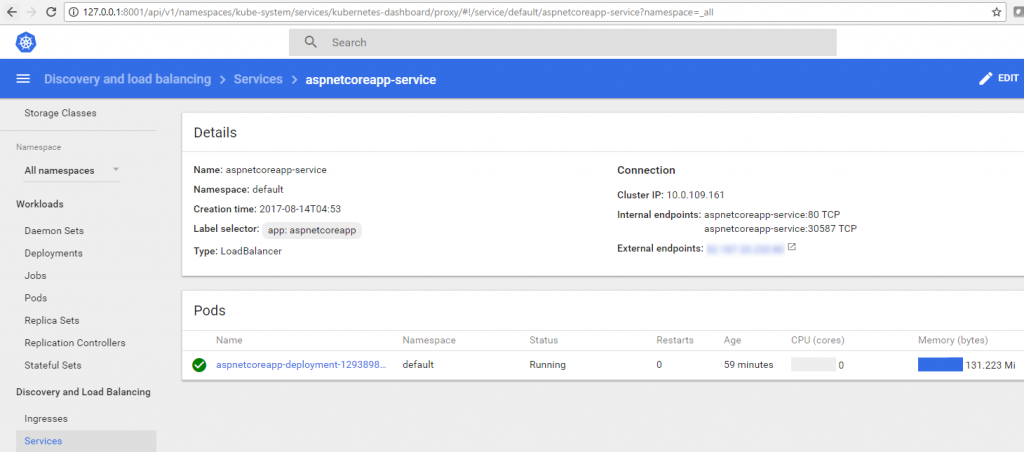
Figure 19. The service is now running with one pod.
This shows that service can scale up pods and replica count when the CPU percentage increases to match the manifest. It can also scale down based on same metric.
Verifying the application
At this stage, a service running the custom ASP.Net Core application image is deployed to the Kubernetes cluster. To launch this application, navigate to the Services menu (#1 in Figure 20) in the dashboard and note the External endpoints column (as shown in #3 in Figure 20).
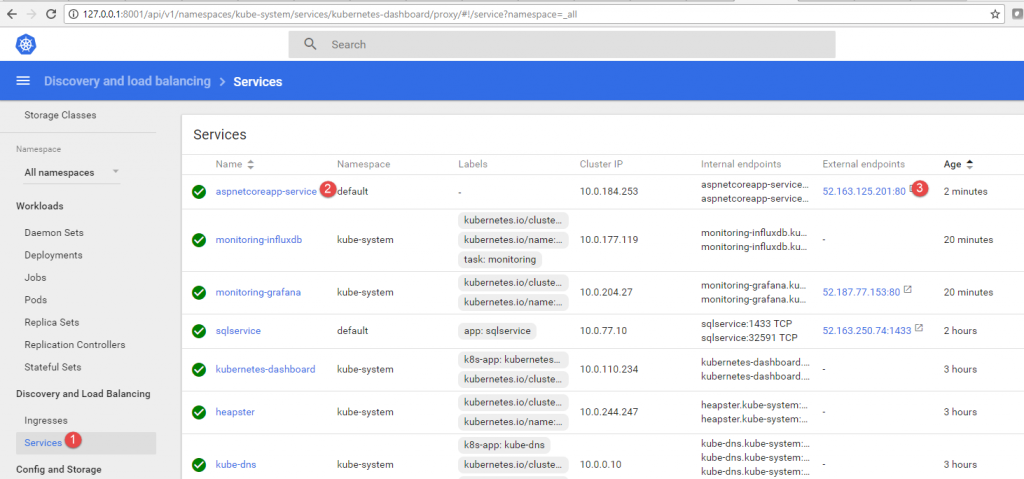
Figure 20. Navigating to view the external endpoint.
The external endpoint is a load-balanced URL serving the application. Copy it and paste it in a new browser tab. It should load the application home page (shown in Figure 21).
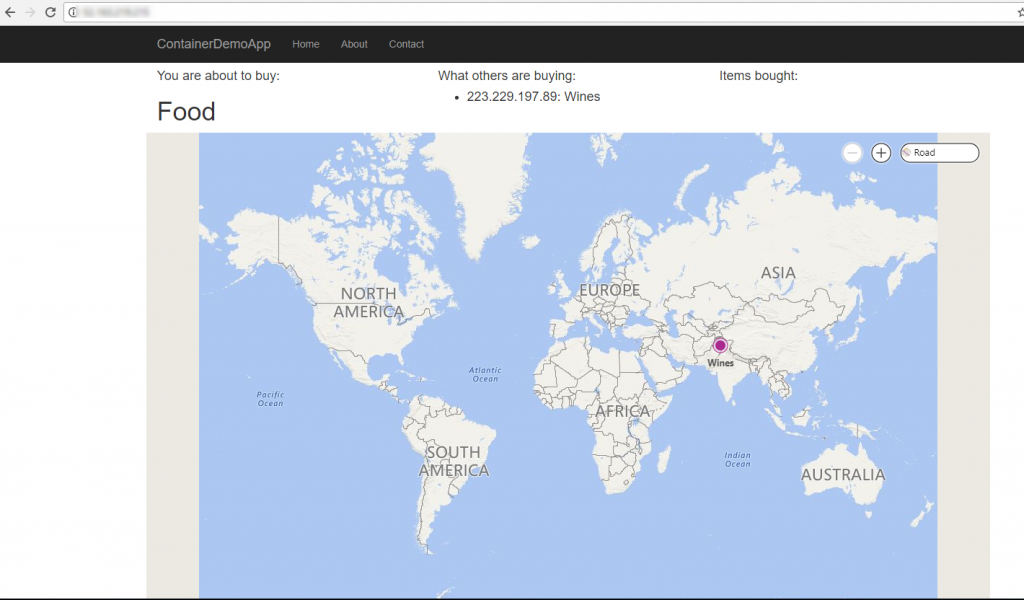
Figure 21. The application home page.
It doesn't matter what this application is doing, except that it is inserting some data in SQL Server (which is also running as a service).
Verifying the database
Connect to SQL Server by using SQL Server Management Studio, and then query the table application that is inserting the data. It should display the results. Follow the four steps shown in Figure 22.
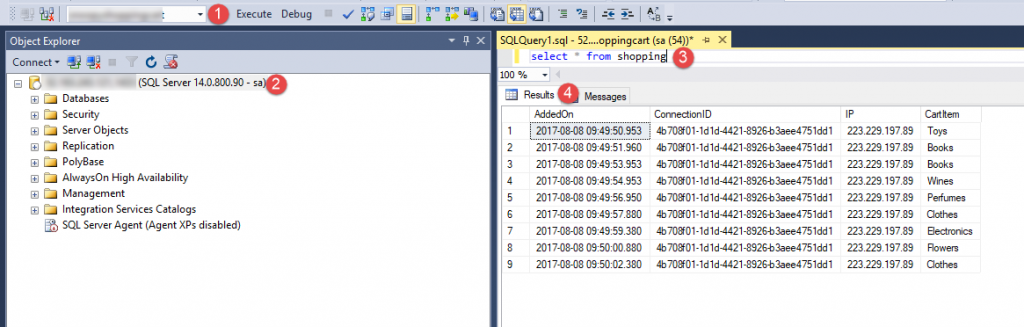
Figure 22. Verifying the database in SQL Server Management Studio.