Collecting Azure Diagnostic logs in real time directly from Azure Storage
The objective here is to take advantage of Azure Diagnostics
functionality to collect Azure Service logs in very simple way. To make it very
simple we will run this cloud service on development fabric however the
diagnostic data will be stored on Azure Storage. We will use Cerebrate Cloud
Storage Studio tool to access to Azure Storage and verify the diagnostics data
in real time. Once you can test your cloud service in the development fabric,
you can package and publish to Azure Portal and you can collect the diagnostic
data in the same way as you did in development fabric.
To start, please create a cloud application,
which includes at least a web role or a worker role. Depend on what kind of role
you have in your cloud service; you just need to add the following highlighted
code snippet in their respective section. The following code snippet is taken
from a service, which have one worker role only:
namespace WorkerRoleDiagDemo { public class WorkerRole : RoleEntryPoint { public override void Run() { // This is a sample worker implementation. Replace with your logic. Trace.WriteLine("WorkerRoleDiagDemo entry point called", "Information"); int i = 0; while (true) { Thread.Sleep(10000); Trace.WriteLine("WorkerRole Running", "Information"); if (i % 2 == 0) { Trace.WriteLine("Trace Entry = " + i.ToString()); EventLog.WriteEntry("Application","Custom Event Entry " + i.ToString(), EventLogEntryType.Error); } i++; } }
public override bool OnStart() { System.Diagnostics.Trace.TraceInformation("OnStart Called"); // Set the maximum number of concurrent connections ServicePointManager.DefaultConnectionLimit = 12; // Get default initial configuration. var config = DiagnosticMonitor.GetDefaultInitialConfiguration(); // DiagnosticInfrastructureLogs - diagnostic monitoring host and configuration changes config.DiagnosticInfrastructureLogs.ScheduledTransferLogLevelFilter = LogLevel.Undefined; config.DiagnosticInfrastructureLogs.ScheduledTransferPeriod = TimeSpan.FromMinutes(1); // Trace message added by you into WADLogsTable config.Logs.ScheduledTransferLogLevelFilter = LogLevel.Undefined; config.Logs.ScheduledTransferPeriod = TimeSpan.FromMinutes(1); DiagnosticMonitor.Start("DiagnosticsConnectionString", config); // For information on handling configuration changes // see the MSDN topic at https://go.microsoft.com/fwlink/?LinkId=166357. RoleEnvironment.Changing += RoleEnvironmentChanging; return base.OnStart(); } } } |
After it, please open your role settings and
modify your “DiagnosticsConnectionString” as below:
Verify your ServiceConfiguration.cscfg should look
like as below:
<?xml version="1.0"?> <ServiceConfiguration serviceName="AzureDiagnosticsASC" xmlns="https://schemas.microsoft.com/ServiceHosting/2008/10/ServiceConfiguration"> <Role name="WorkerRoleDiagDemo"> <Instances count="1" /> <ConfigurationSettings> <Setting name="DiagnosticsConnectionString" value="DefaultEndpointsProtocol=https;AccountName=avkashstore01;AccountKey=###########################################################==" /> </ConfigurationSettings> </Role> </ServiceConfiguration>
|
Note: The account key has been marked #### to protect
my key info.
That’s it.
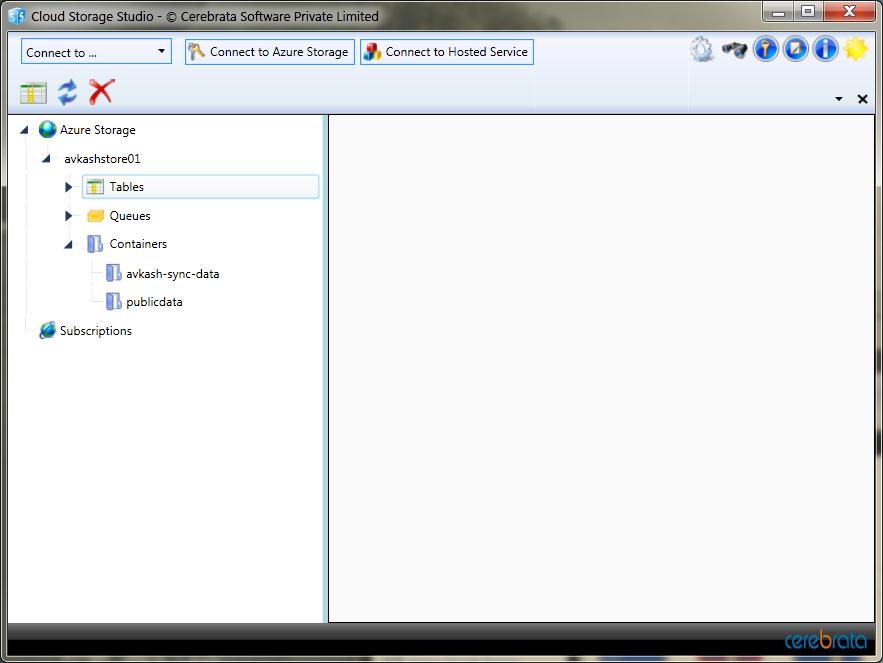
Let’s now verify on Azure Storage that we don’t have
any previous table existed. (I just want to show here that new tables are
created and entries are written there. In your case, you may already have tables
in your storage account)
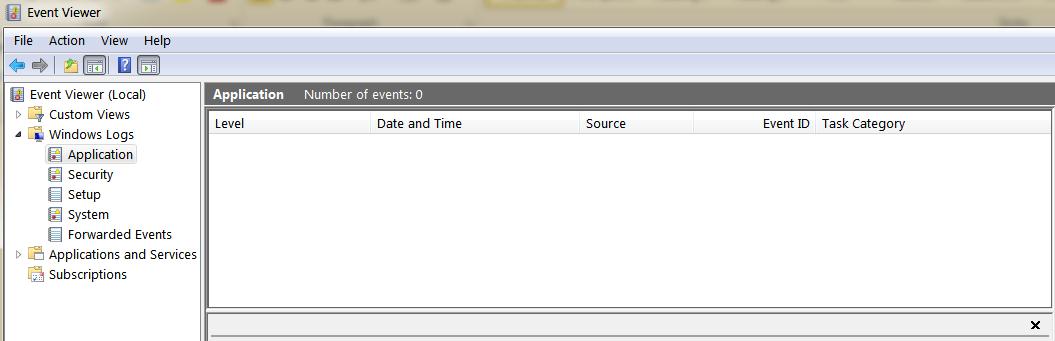
I have also cleared the Application Event log on my machine as
below:
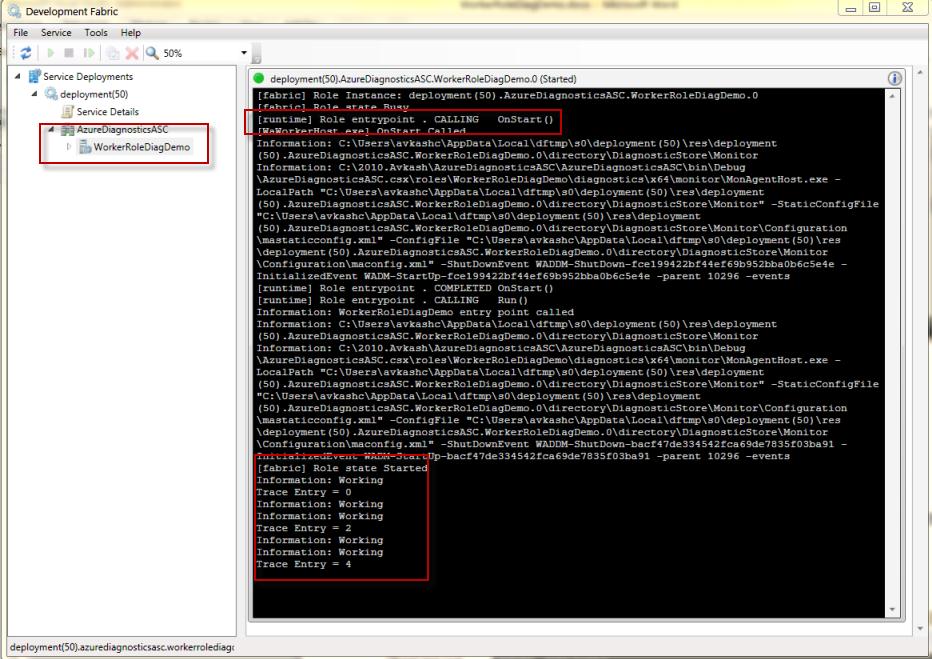
Now we will be launching the application in the development fabric.
Please launch the development fabric UI as below:
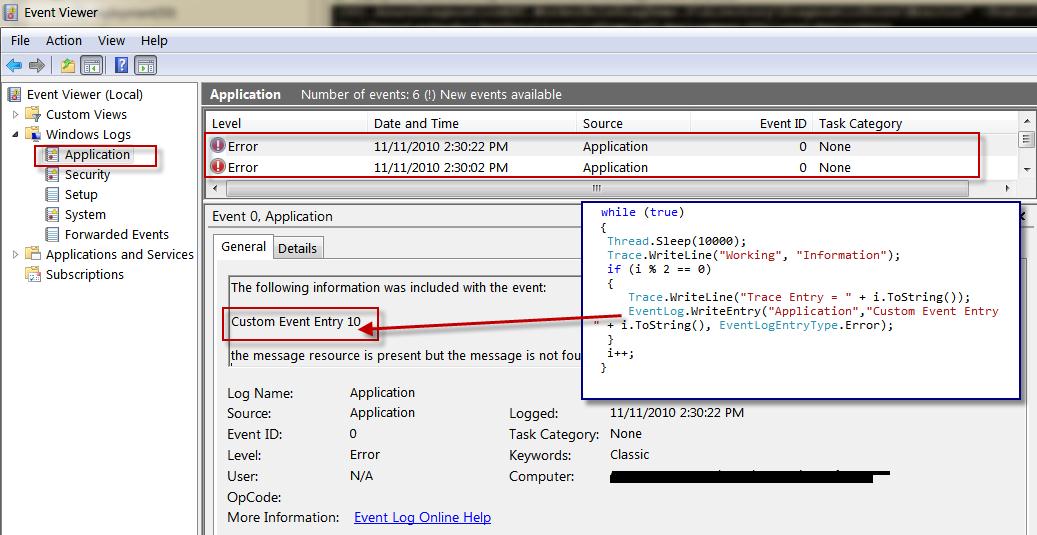
Opening the Event Log to verify the Event Entries:
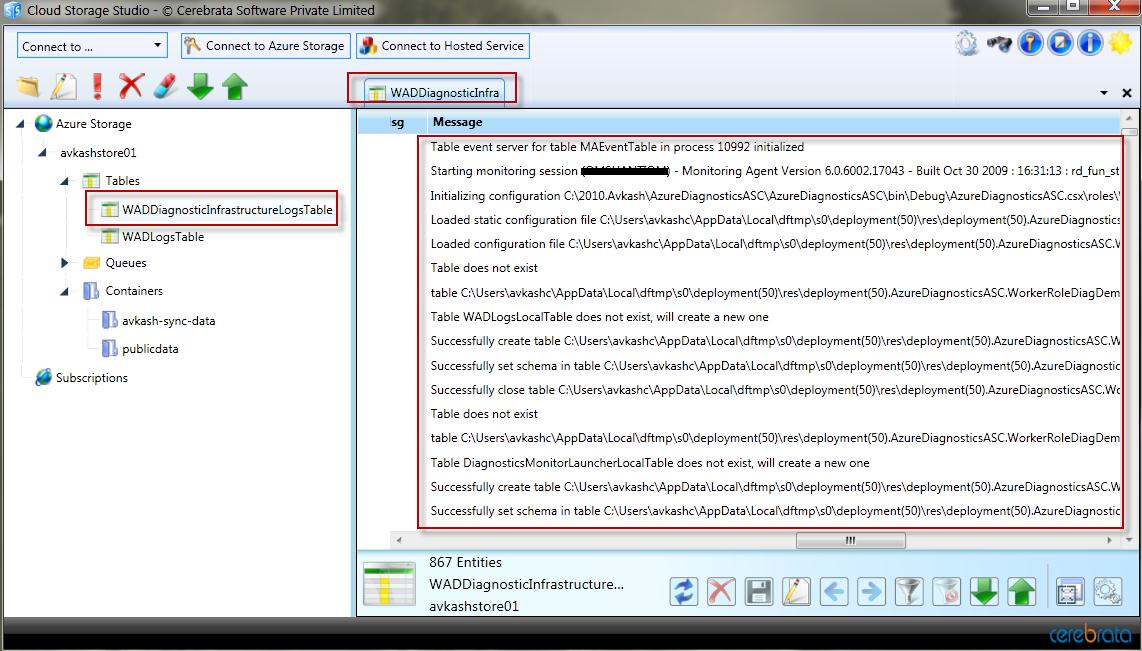
Opening the table storage on Cerebrata Cloud Storage Studio shows two new
tables created as below:

Opening
WadLogsTable contents shows our WADLogTables Entries which we have added using
Trace.WriteLine
Trace.WriteLine("Working", "Information"); ….. …. Trace.WriteLine("Trace Entry = " + i.ToString()); … |

Now opening
WADDiagnosticInfrastructureLogsTable we could see the general logs as below:
If you package this solution and run
on cloud you can verify the same results. The only difference would be that you have no way to see the Azure VM event log from development
fabric. However you can add the necessary code to see Event log and other info
from Azure diagnostics component. I will write another blog to complete that
info as well.